Financial Market Insight - October 2024

FINANCIAL MARKET INSIGHT


VANN EQUITY MANAGEMENT

October 2024

Container 1
Container 2

HIGHLIGHTS

  • Why the Next Two Weeks Are So Important for This Market
  • Market Preview: Magnificent Seven Earnings and Important Economic Data
  • Economic Cheat Sheet: Jobs and ISM Manufacturing PMI on Friday
  • Sentiment: Still Not as Wildly Bullish as You Might Think
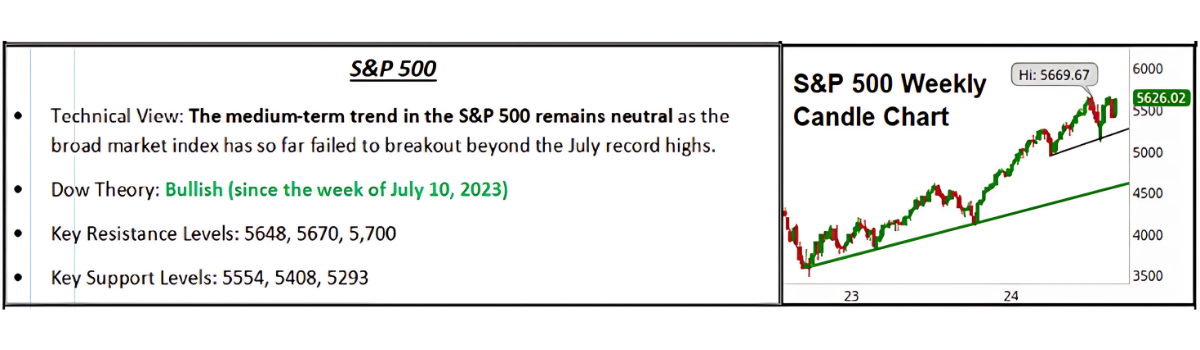
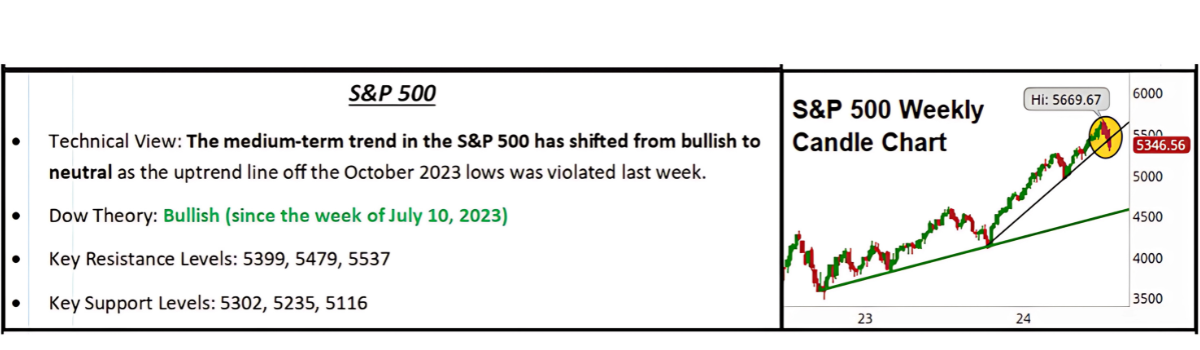
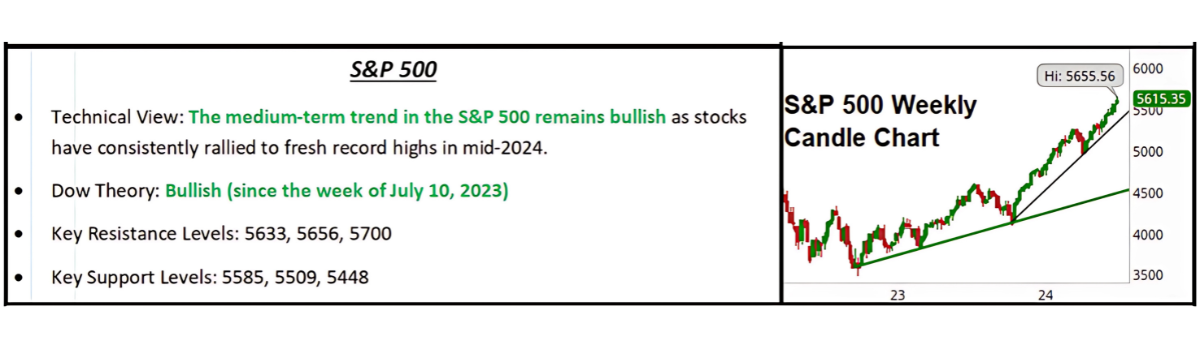
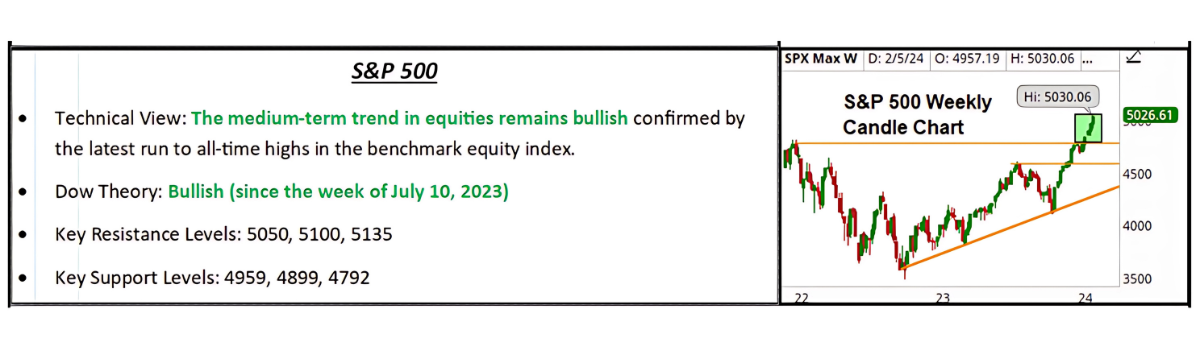
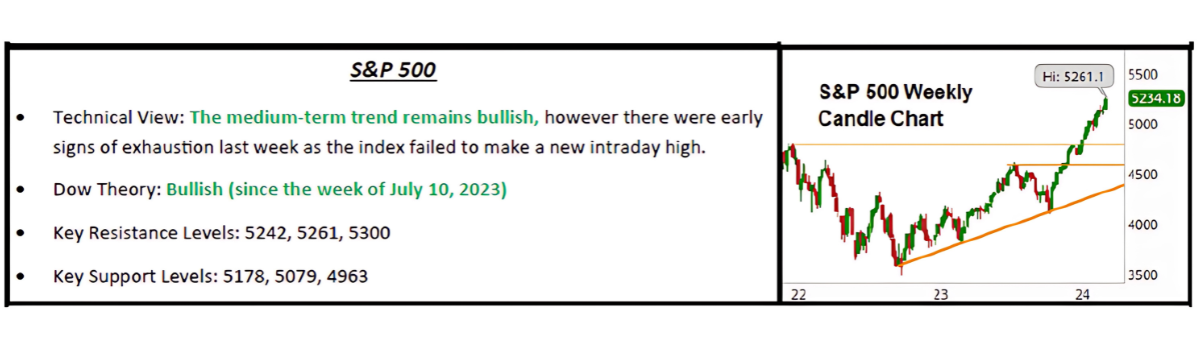
Container 3

STOCKS

“Stocks declined modestly last week as Treasury yields rose to multi-month highs while earnings results were a bit more mixed, although the declines were modest especially compared to the recent rally.”

What is Outperforming: Defensive sector, minimum volatility, and sectors linked to higher rates have relatively outperformed recently as markets have become more volatile.

What is Underperforming: Tech/growth and high valuation stocks have lagged as yields have risen.

Container 4

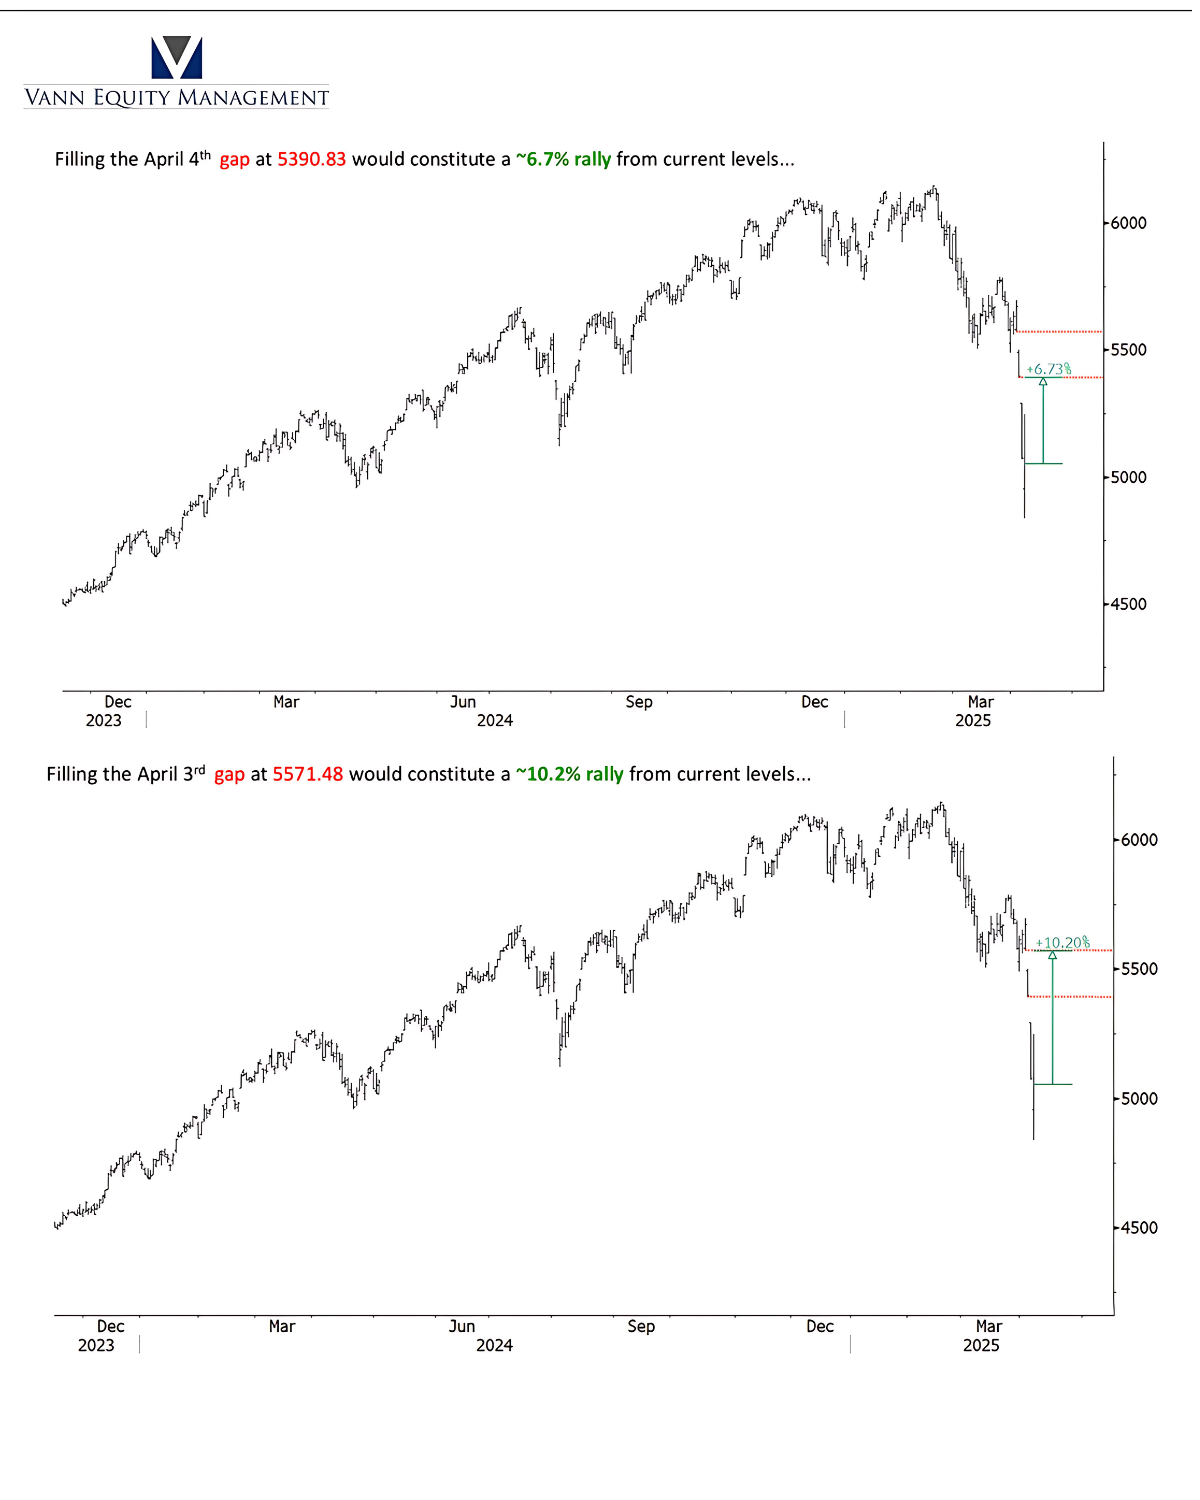
A Critical Two Weeks for the Rally

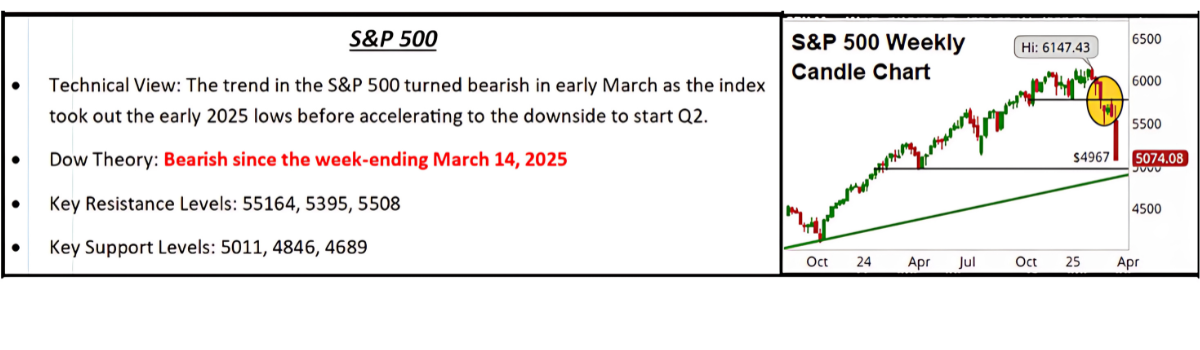
It is not an exaggeration to say that the next two weeks could likely determine if stocks hold (and potentially extend) the YTD gains, or if volatility re-emerges and we have a tumultuous end to what has been, so far, a good year in the markets.

We say that not to be hyperbolic, but instead because it is true, as each of the major supports of this rally will be tested over the next two weeks, and if the current positive market expectations are undermined, the S&P 500 could hit an air pocket of roughly a 5%-10% pullback (or possibly worse).

Let us Examine the Major Tests of Support in the Equity Market:

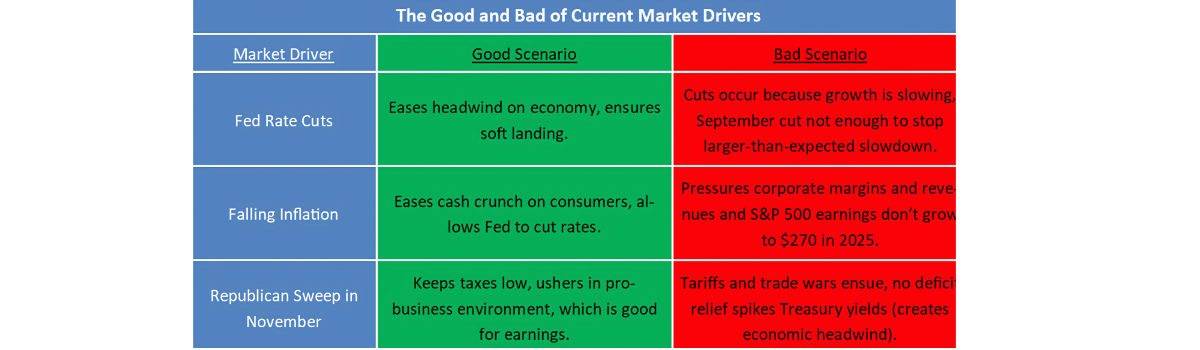
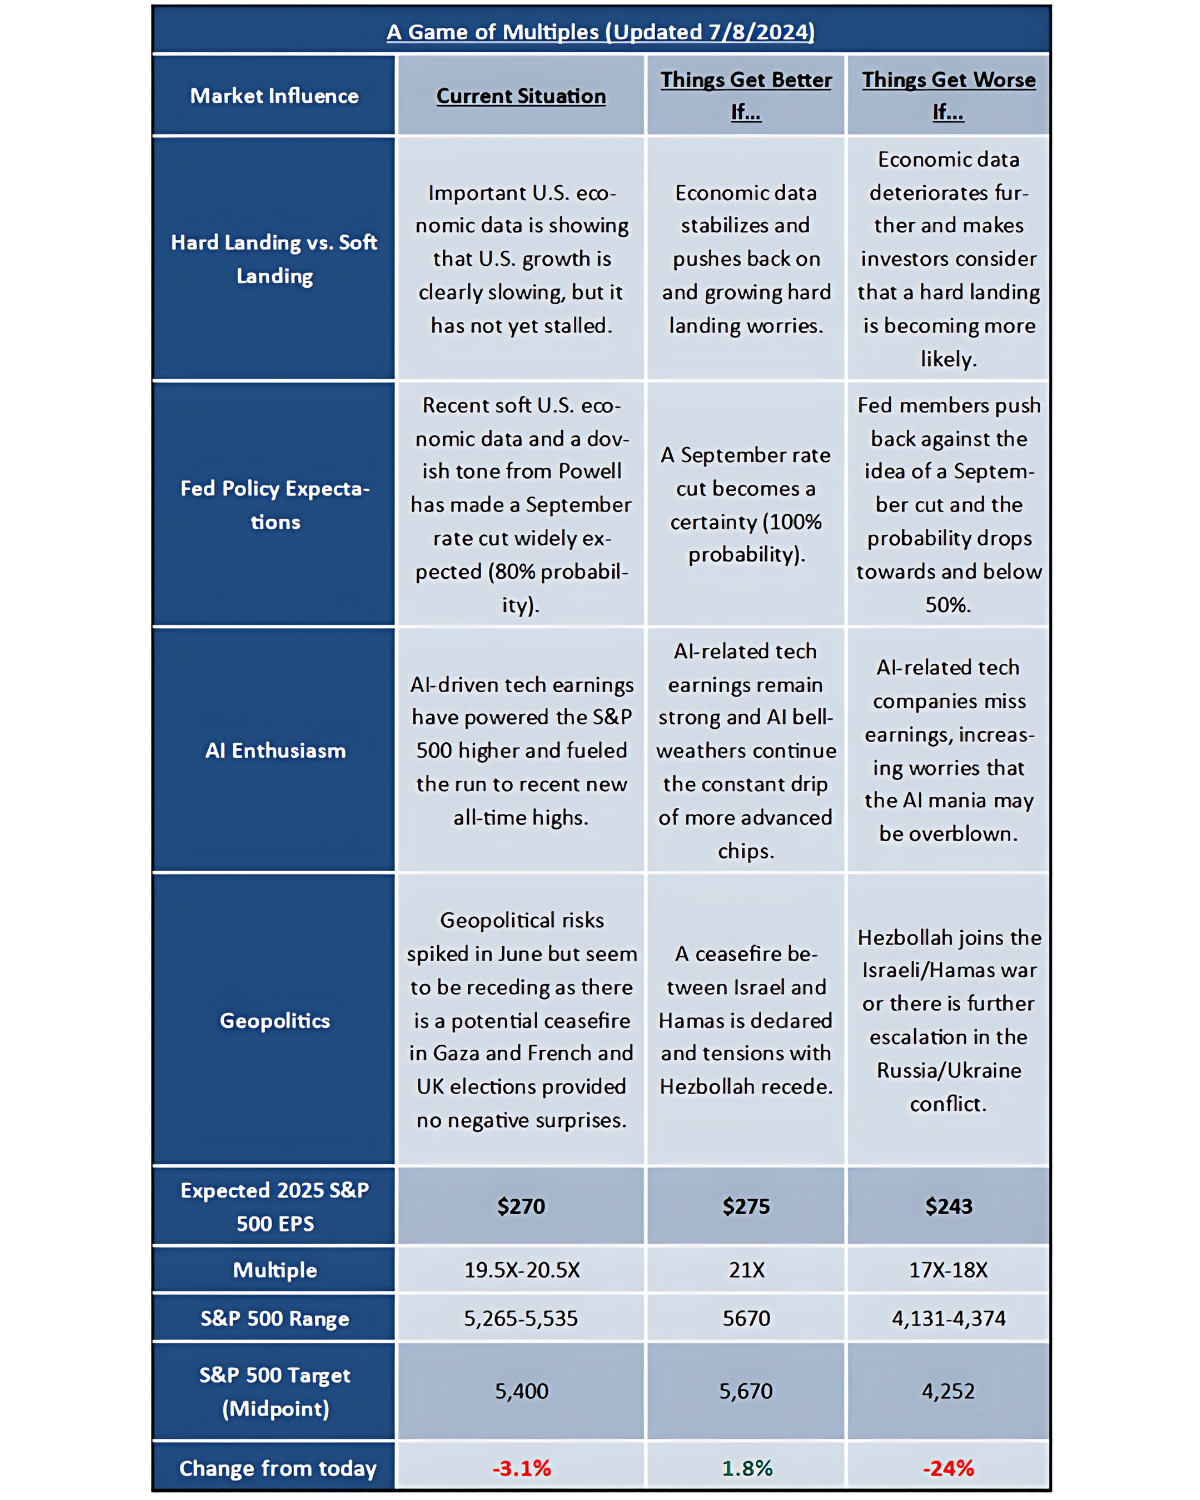
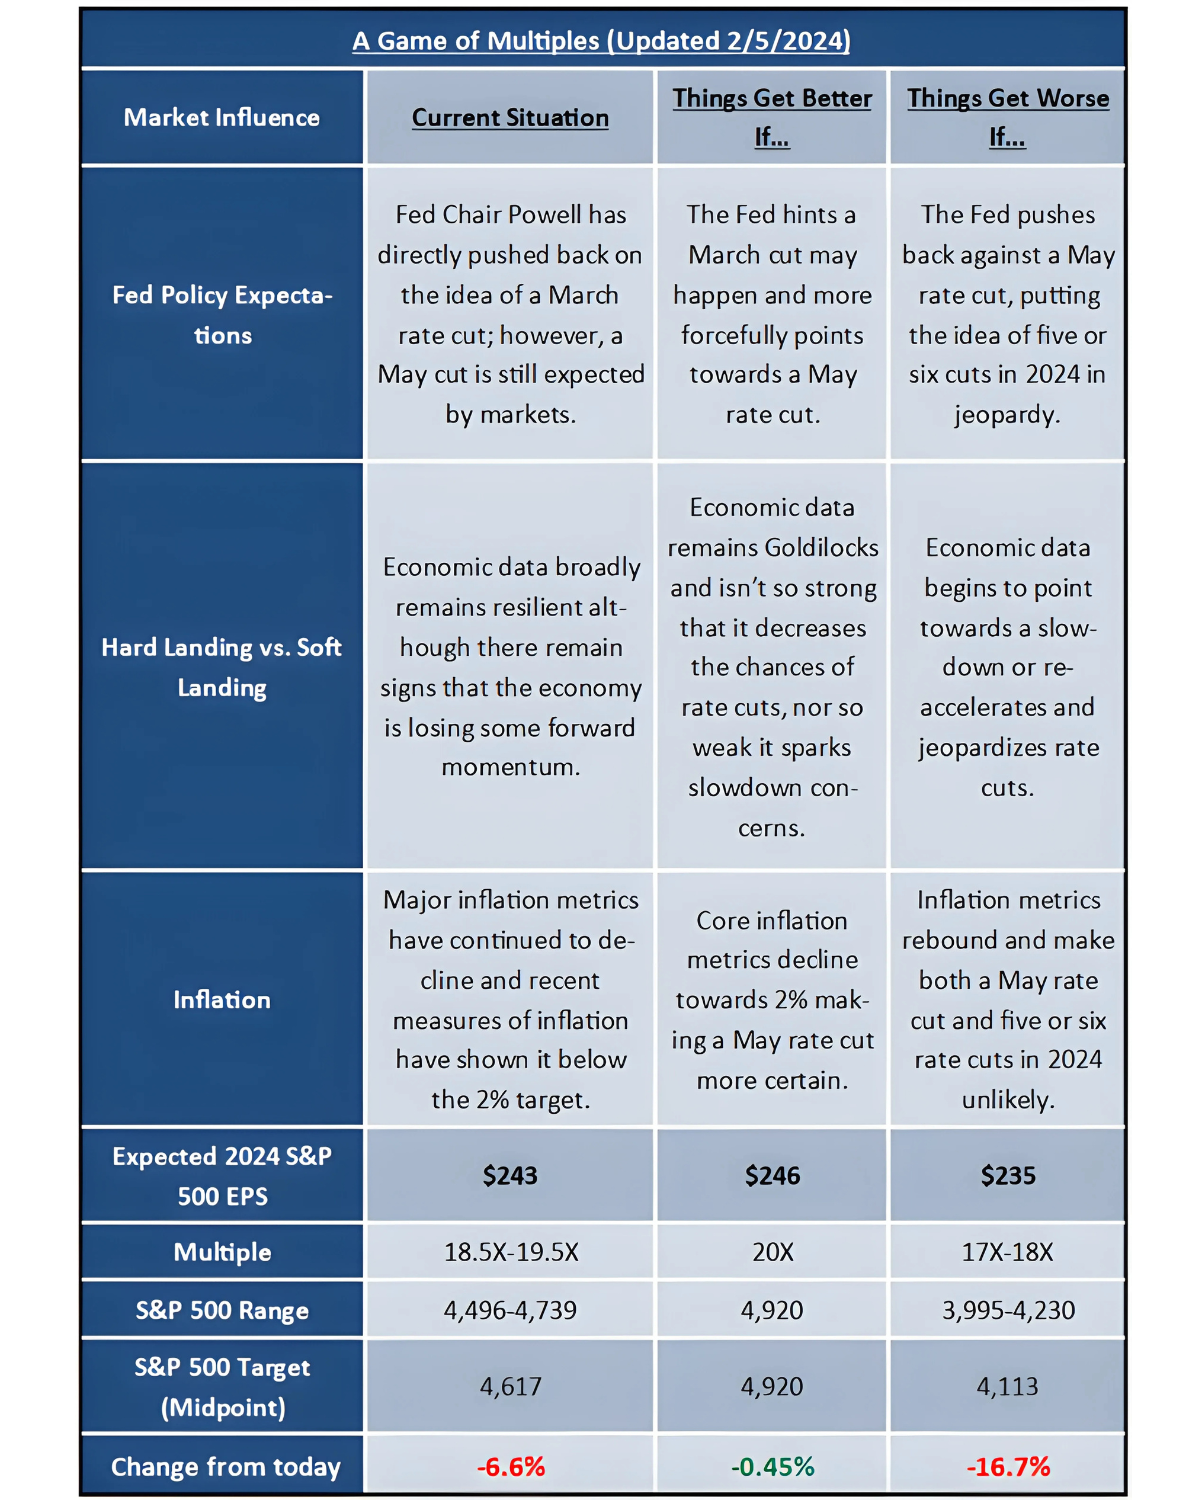
Test #1: Soft Landing

We have seen quite a switch in the outlook for the economy over the past two months. In July, a soft landing was all but guaranteed. However, hard landing fears rose (and stocks dropped) in August and September as the labor market data disappointed. Then, over the past month, data has rebounded and at this point, a “no landing” possibility is openly discussed. Over the next two weeks, we will get important economic updates that will either 1) Validate the soft-landing thesis (positive for stocks) or 2) Challenge it (one way or the other, via a no landing or hard landing). Specific data points to watch include the jobs report, ISM Manufacturing PMI¹, and Services PMI (the first two out this Friday, the Services PMI out next week). For markets to pass this test, economic data needs to remain Goldilocks (so not too hot and imply no landing and less rate cuts, or too soft and hint at a recession).
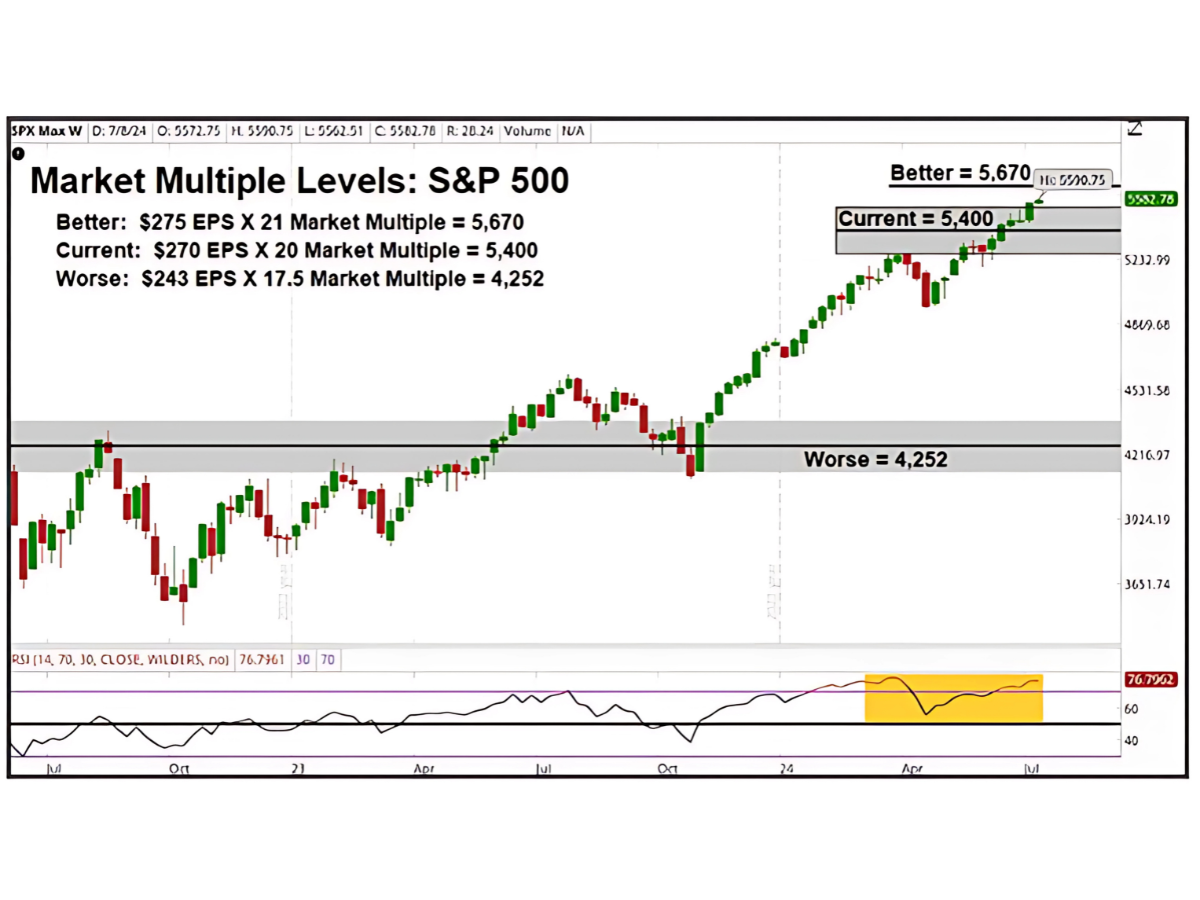
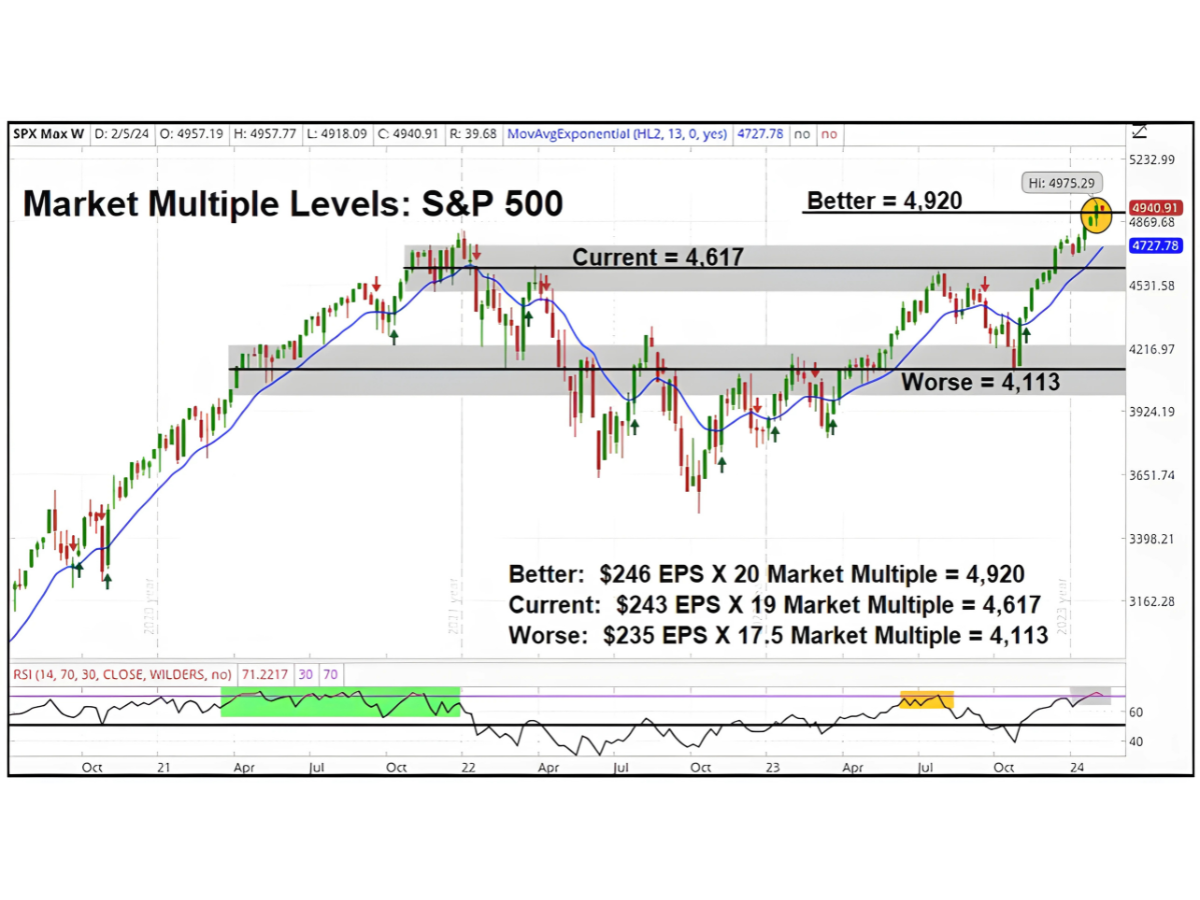
Test #2: Earnings

Earnings have been, in many ways, the “unsung hero” of this rally as earnings growth has remained remarkably consistent throughout 2024, allowing the S&P 500 the fundamental justification to rally to current levels. But we get the final earnings updates for 2024 this week, including AMD/GOOGL and V on Tuesday, META/MSFT on Wednesday AAPL/AMZN, and INTC on Thursday. For the market to pass this test, we need to see guidance from these companies remain upbeat and above expectations, underscoring that earnings growth is solid.

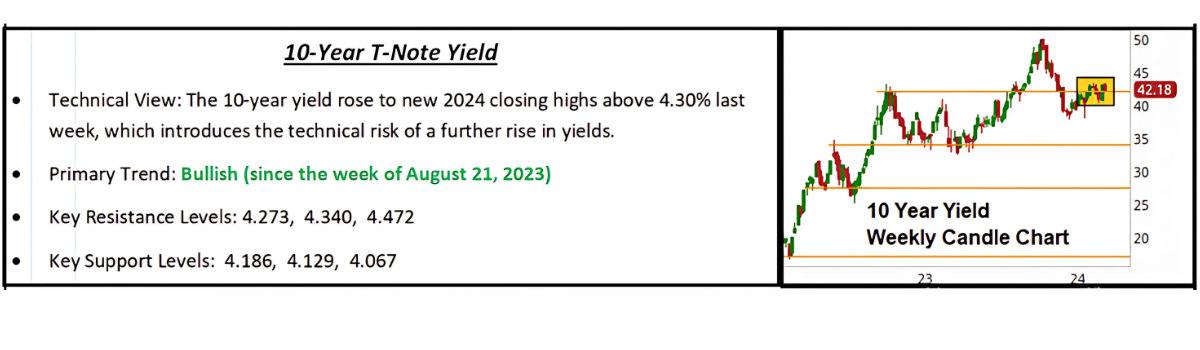
Test #3: Aggressive Fed Rate Cuts

Fed expectations have also shifted wildly in the past few months, as in June just one rate cut was expected, while by August multiple rate cuts were forecast by year-end. The Fed validated those dovish expectations via the 50-bps cut in September and markets proceeded to price in another 75-bps of cuts between then and December. Since then, because of good data and stickier inflation, rate cut expectations have declined to just two 25-bps in November and December and that is less certain than before. For the market to pass this test, Fed rate cut expectations need to stay at two 25-bps cuts in November and December (and not decline below 50-bps of additional easing).

Test #4: Political Calm

Markets have been amazingly resilient in the face of geopolitical upheaval (two ongoing major wars) and throughout this election season, but that will be tested on November 5th! Depending on when the outcome is known (no verdict on, or shortly after election night would be a worst-case for markets) and the make-up of the government post-election, markets may be forced to face (and account for) looming fiscal challenges in the form of budget battles, elevated trade tensions or similar issues. Meanwhile, the transition of power in the U.S. may embolden global adversaries and potentially intensify global conflicts. For the market to pass this test, we need to have political clarity out of the election and have the geopolitical situations (wars) NOT spread or intensify.

Bottom line: The market has been incredibly resilient this year, but that resilience will be tested in a big way over the next two weeks. Vann Equity Management will be here, committed to helping you cut through the noise and stay focused on the core drivers of this market, which remain growth, Fed rate cuts, and earnings. Ultimately, they will determine whether this market extends this rally into year-end; or if we see an uptick in volatility that makes the final two months of 2024 more difficult than the first 10. We have your back!

¹ ISM manufacturing index, also known as the purchasing managers’ index (PMI), is a monthly indicator of U.S. economic activity based on a survey of purchasing managers at manufacturing firms nationwide. PMIs use a monthly questionnaire survey of selected companies which provide an advance indication of the performance of the private sector. It achieves this result by tracking changes in variables such as output, new orders, and prices across the manufacturing, construction, retail and service sectors. It is considered to be a key indicator of the state of the U.S. economy.

Container 5

Economic Data (What You Need to Know in Plain English)

The recent rally in stocks (off of the September lows) has been underwritten mostly by Goldilocks economic data, which largely continued into the end of October. So, while there was some mild profit-taking in stocks, the bigger takeaway has been that an economic soft landing remains the most likely outcome (which is important for the long-term sustainability of this rally).

The key report for October was the flash PMIs and they were Goldilocks! The composite headline beat estimates at 54.3 vs. (E) 54.0, while we saw a familiar weakness in manufacturing (still below 50), but it was not worse than feared at 47.8 vs. (E) 47.6. Finally, the flash Services PMI, which is the most important reading, remained strong at 55.3 vs. (E) 55.0.

Looking at jobless claims, they were mixed as initial claims declined to 227k vs. (E) 243k, and claims have now reversed, again, a temporary spike up towards 260k. Notably, Continuing Claims reached a three-year high, implying those who have been laid off are having a harder time finding new jobs. Now, part of that pop could be because of extended unemployment from the hurricanes or the ongoing Boeing strike. Nonetheless, our team thinks it is fair to say we are seeing cooling in the labor market, just not enough at this point for it to be a negative economic signal.

Bottom line: Economic data has been Goldilocks, and that is a good thing for stocks and bonds because it keeps a soft landing as the most likely economic outcome (and justifies much of the 2024 rally) and because it keeps the Fed on track to continue to ease rates (including two more 25-bps cuts this year).

Container 6

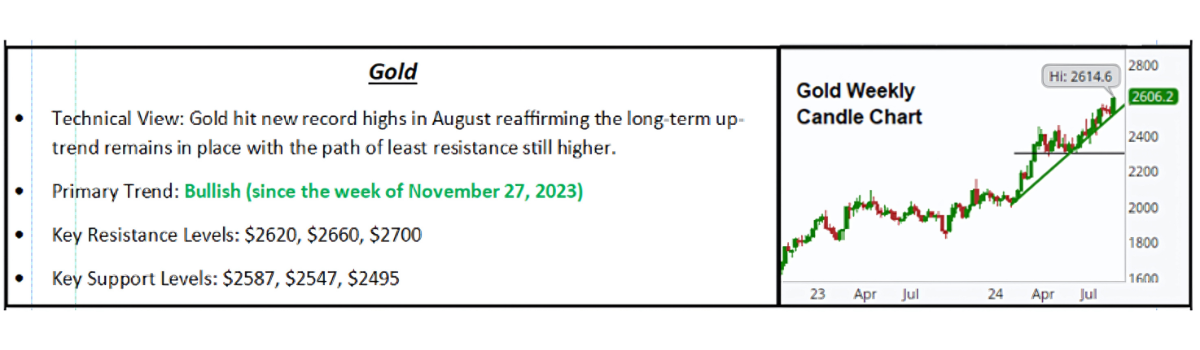
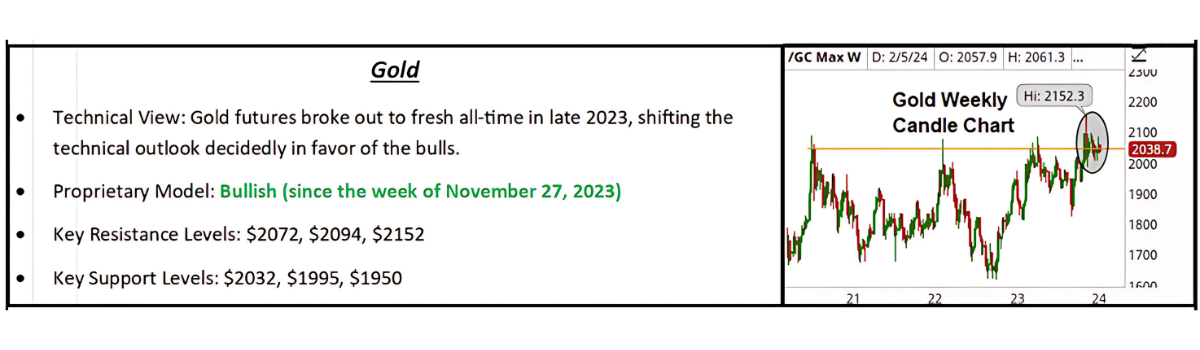
COMMODITIES, CURRENCIES & BONDS

“Commodities traded with a bias to the upside last week thanks to simmering geopolitical tension supporting gains in oil while inflation worries and Goldilocks global economic data kept a bid in both industrial and precious metal varieties.”

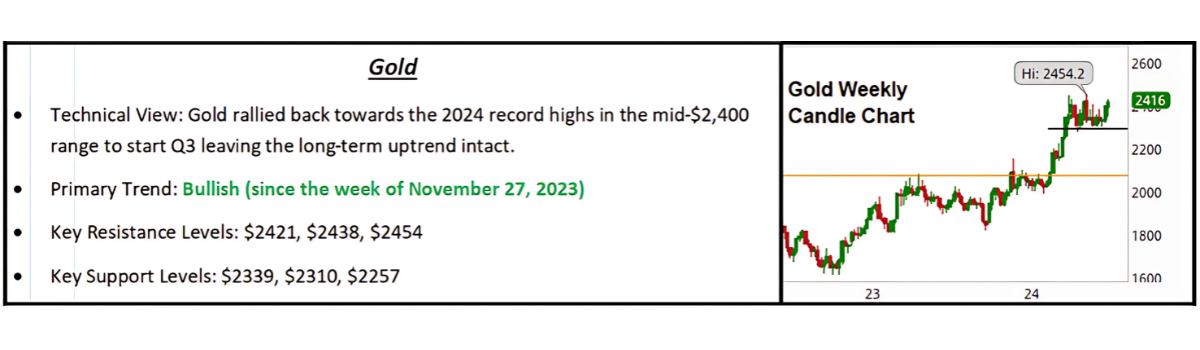
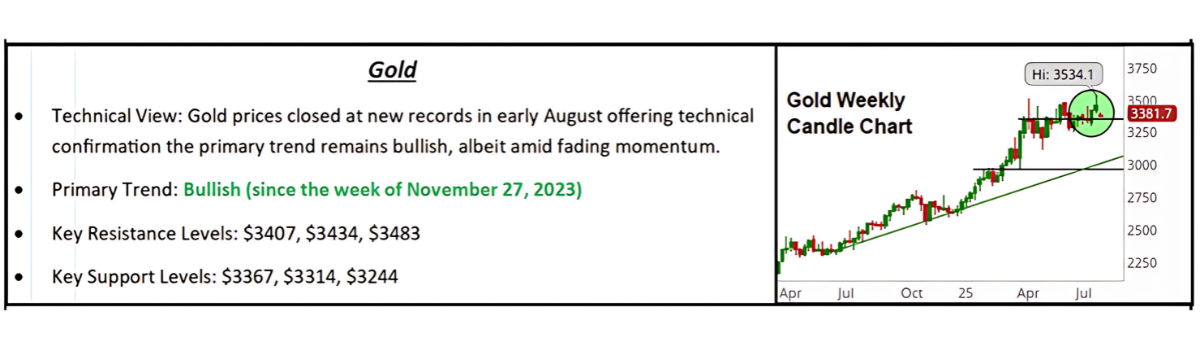
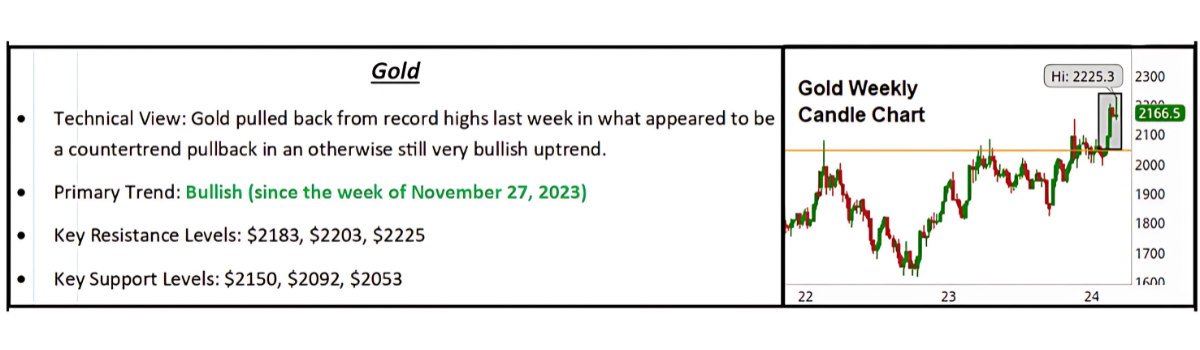
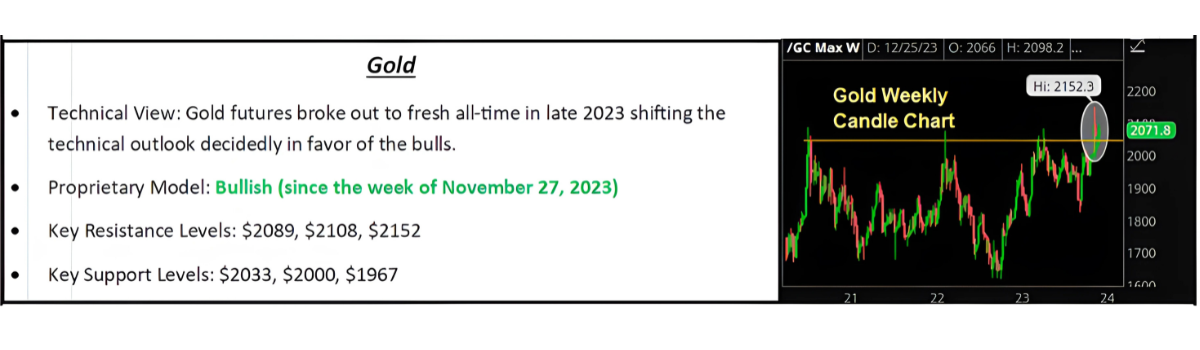
Commodities trade with a bias to the upside as lingering geopolitical tensions kept a fear bid in the oil market while industrial metals were little changed on the economic data, but gold extended the YTD advance to new record highs amid upward-trending inflation expectations.

Looking ahead, there continues to be a fading outlook for demand in oil as an uncertain outlook for the global economy paired with prospects for a rise in global production in the months ahead (thanks to U.S. output hitting new records this month) and OPEC+ members planning production target increases in December, leave the threat of a surplus in the global oil market elevated. Geopolitics remain a critical near-term influence, however, the threat of a price spike in the wake of the weekend’s retaliatory attacks by Israel on Iran is a distinct possibility.

Switching to precious metals, worries about inflation, for now, leave the fundamental backdrop of the gold market bullish, matching the uptrend on weekly charts.

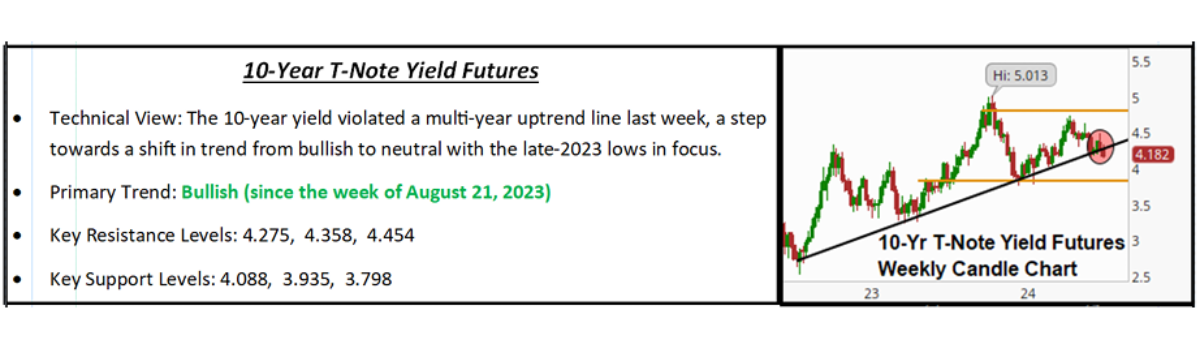
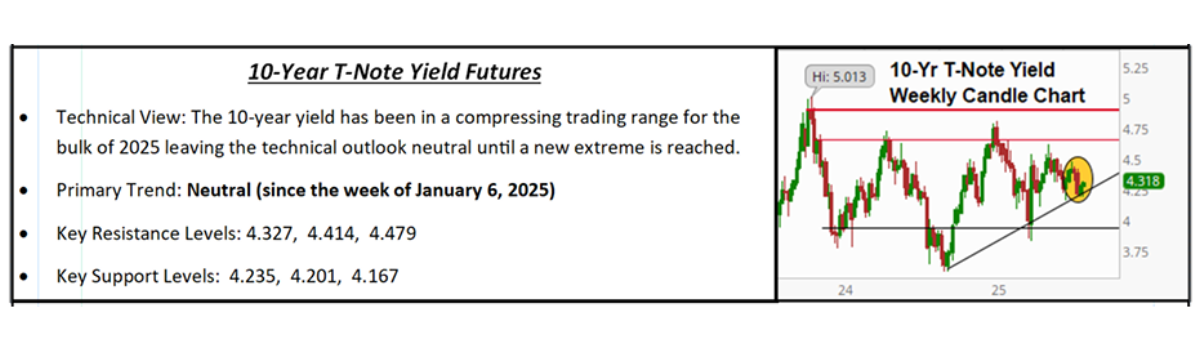
“The Dollar Index extended the gains last week and hit a multi-month high thanks to solid economic data and rising yields.”

Container 7

Still Not as Wildly Bullish as You Might Think

Sentiment data this month provided a bit of a surprise, because our investment team assumed with the relentless rally in stocks investor sentiment would be pushing the highs of 2024. However, despite a positive view and clear optimism, sentiment is not at the levels that would, by itself, make us concerned the market has become unsustainably stretched. So, while investors are bullish, there is anxiety despite the new highs.

Now, perhaps that level of anxiety is tied to the election, which will be behind us in next month’s sentiment reading; or perhaps it is because investors’ economies are not quite as strong as the S&P 500. Regardless, investors are not as greedy or extremely bullish as the stock market performance would typically imply.

From a market standpoint, there are two takeaways from this analysis. First, sentiment is not widely bullish enough to cause a correction, and that is good. Second, sentiment is still complacent and if one of the positives in this market (stable growth, Fed rate cuts) disappoints, then current levels of elevated bullishness amongst investors and advisors reinforce that we could easily see a 5%-10% air pocket in the S&P 500 (even if the news is not that fundamentally negative).

Bottom line: Sentiment is not a reason to lighten up on stocks, but it does leave this market still vulnerable to a short, sharp pullback, even if the news is not that bad, and we want everyone to be aware of that from an expectations standpoint.

AAII Investor Sentiment

CNN Fear & Greed Index

Investors Intelligence Advisor Sentiment

Container 8

Disclaimer

The Financial Market Insight is protected by federal and international copyright laws. Vann Equity Management is the publisher of the newsletter and owner of all rights therein and retains property rights to the newsletter. The Financial Market Insight may not be forwarded, copied, downloaded, stored in a retrieval system, or otherwise reproduced or used in any form or by any means without express written permission from Vann Equity Management. The information contained in Financial Market Insight is not necessarily complete and its accuracy is not guaranteed. Neither the information contained in Financial Market Insight, nor any opinion expressed in it, constitutes a solicitation for the purchase of any future or security referred to in the Newsletter. The Newsletter is strictly an informational publication and does not provide individual, customized investment or trading advice. READERS SHOULD VERIFY ALL CLAIMS AND COMPLETE THEIR OWN RESEARCH AND CONSULT A REGISTERED FINANCIAL PROFESSIONAL BEFORE INVESTING IN ANY INVESTMENTS MENTIONED IN THE PUBLICATION. INVESTING IN SECURITIES, OPTIONS AND FUTURES IS SPECULATIVE AND CARRIES A HIGH DEGREE OF RISK, AND SUBSCRIBERS MAY LOSE MONEY TRADING AND INVESTING IN SUCH INVESTMENTS.

September 2024 Market Insight | Vann Equity Management
Vann Equity Management

Financial Market Insight

📅 September 17, 2024 📊 Monthly Market Analysis 🏛️ Institutional Research

Highlights

Key Takeaways

  • How to Explain This Market (September Update)
  • Weekly Market Preview: Two Key Central Bank Decisions (Fed on Wednesday, BOJ on Thursday)
  • Weekly Economic Cheat Sheet: Important Growth Updates This Week

Stocks

Stocks rallied and the S&P 500 climbed close to previous all-time highs thanks to solid tech earnings from ORCL and increased expectations for a 50-bps rate cut from the Fed.

✓ What is Outperforming: Defensive sector, minimum volatility, and sectors linked to higher rates have relatively outperformed recently as markets have become more volatile.

✓ What is Underperforming: Tech/growth and high valuation stocks have lagged as yields have risen.

How to Explain This Market

Over the weekend our investment team spoke to several investors who were in somewhat of disbelief that stocks remained so resilient in the face of political uncertainty and, what is to them a slowing economy; and in those discussions, we pushed back on some of their negative expectations, and it was very well received, so we wanted to share our points with you below.

First, and importantly, the burden of proof remains with the bears. Put simply, the news is not bad enough yet to cause a sustainable decline in stocks. Yes, there are anecdotal economic and earnings warning signs including the rising unemployment rate, the very weak ISM Manufacturing PMI¹, negative bank guidance, and an uncertain retail environment. Yes, there are negative macro risks out there: Political uncertainty (Harris or Trump?), economic uncertainty (soft or hard landing), and geopolitical turmoil (Russia/Ukraine, Israel/Hamas, Taiwan). However, those potential risks and anecdotal negatives, while all legitimate, are not yet enough to distract investors from positive factors in this market.

Those positive factors are:

  1. Still generally “ok” economic data (yes, it is clearly slowing, but as of right now it is still “ok”).
  2. Looming Fed rate cuts (investors often ignore the reality that Fed rate cuts do not always extend market rallies, so they initially welcome cuts as a bullish positive).
  3. Expected earnings growth (still more than 10% y/y).
  4. AI enthusiasm (it has been reduced but is still alive as last week’s price action showed us).

Second, while a “Wall of Worry” still exists, stocks remain resilient. Those risks of uncertainty we just laid out in our first point (Political, Geopolitical, and Economic) are negatives that could indeed happen (and if they do, they would be bearish game changers); but right now, they are not happening. So, as data points and news fail to reinforce those concerns, we are seeing stocks grind higher.

Third, that leaves a market dynamic where the S&P 500 could easily hit a new high this month. If economic data this week does not confirm growth fears and the Fed cuts 50 bps (or cut a of 25 bps and promises of further aggressive rate cuts) we should not be shocked if the S&P 500 moves to a new, all-time high. However, new highs this week would not mean this market is not still facing serious risks. While the S&P 500 can grind higher in the short term, the reality is that 1) Growth is slowing, 2) Rates are falling, 3) Earnings growth is facing headwinds and 4) Political and geopolitical risks remain high.

The combination of these looming risks and the very elevated valuations make this market very exposed to 1) Dramatic negative shocks that could cause a sharp “air pocket” in stocks similar (or worse) to what we saw in early August and 2) A growth scare that would easily open up a 10%-20% sustainable and long-lasting decline in stocks.

Bottom line: The risks currently facing this market (economic growth, earnings, geopolitics) are tectonic risks. They do not present themselves all at once or in a flash, they evolve over time until they become sustainable and that is when bear markets occur. This market is facing those risks but facing them does NOT mean they will happen. That is why our investment team believes the right way to navigate this market is that we closely monitor these risks, while not prematurely abandoning the long side. Our team has advocated this management strategy throughout 2024, and it has been working, and it is what we continue to believe is the right way to successfully navigate this current market. If and when the facts change, our outlook will change and you will hear it first, loudly and clearly.

Economic Data (What You Need to Know in Plain English)

Inflation was the focus of last week’s data, and the message was remarkably consistent: The decline in inflation slowed, not to the point where it would be a problem for markets or the economy, but it could push back on any Fed member’s desire to very aggressively cut rates (they are still going to cut this week, but maybe not as much as before).

The key inflation report was CPI, and it was firmer than expected. Headline CPI dropped sharply to 2.5% y/y (down from 2.9%) but most of that drop was energy-related (lower oil prices). The more important Core CPI was flat vs. July, rising 3.2% y/y. The monthly increase was a touch high, rising 0.3% vs. (E) 0.2%. These inflation numbers are not bad in the broad sense, and they do not imply inflation is bouncing back (it is not) but for those hoping for very aggressive rate cuts.

S&P 500 Chart

Part of what is supporting stocks is investor expectations for aggressive interest rate cuts, and last week’s inflation data legitimately reduces the case for 50-bps Wednesday. It may still happen, but the hawks on the FOMC have some fresh data to point to if they want to advocate “going slowly.” The question “Is the Fed behind the curve” is becoming the most important question in this market. The freer the Fed is to cut rates aggressively, the smaller the chances it falls behind the curve and we get a deeper-than-expected slowdown. The firm CPI reduces some of the Fed’s flexibility to be aggressive and while that is not a near-term negative, it reduces the margin of error for the Fed and that is something we need to keep in mind as we move towards the end of the year.

Looking at actual hard data, we have a lot of potentially important economic reports this week that will give us greater insight into the state of the economy. First, Retail Sales come tomorrow, and this number has been plateauing for several months. If it suddenly drops and implies the consumer is no longer just being discerning but not outright pulling back, that will be negative, and increase fears the Fed is behind the curve.

We are going to learn a lot this week about actual Fed rate cuts vs. expectations and the current state of economic growth. A dovish Fed and solid data will increase soft landing hopes and imply the Fed is not behind the curve, at least for now, and stocks should rally.

Commodities, Currencies & Bonds

Commodities were mixed to start last week as demand fears persisted in the wake of several weak industry reports. However, dovish bets for a 50 bps cut from the Fed this week rekindled soft landing hopes and shored-up demand expectations, driving the complex higher into the weekend with metals and energy all notching weekly gains.

Gold Weekly Chart

The outlook for oil remains bearish despite a mid-September relief rally beginning last week. Fundamentals are pointing to an increased likely surplus emerging in the physical markets in the months or quarters ahead and recession fears continue to simmer despite a resurgence in soft-landing hopes. On the charts, last week’s low close of $66.31 will be looked to for initial support while previous support at $72.50 will present initial resistance.

Turning to the metals, the big development has been the renewed push higher by gold, which launched to new record highs thanks to the dovish money flows resulting from the combination of a potential 50-bps cut this week and mostly cooler-than-anticipated inflation metrics released over the course of the week. The bottom line for gold, the trend is decidedly bullish, and it would take a materially hawkish reversal in broad market money flows to derail this advance.

Looking at the industrial metals, copper has been beaten up the most and had the most to recover during the relief rally. Copper ended the week higher by 3.84%. Futures remain rangebound between $4.05 and $4.30 for now.

The Dollar Index declined modestly last week despite the slightly more firm CPI report as the ECB cut rates but was not any more dovish than expected and as expectations for a 50-bps cut rose.

Hopes for a 50-bps cut offset the firm CPI and PPI last week as the Dollar Index declined 0.25%. The dollar was initially flat-to-slightly higher through the middle of last week but the WSJ article by Timiraos and the Bill Dudley article on Friday (one hinting at 50 bps, the other calling for it) weighed on the dollar as expectations for 50 bps rose.

Those rising rate cut expectations from the Fed combined with an ECB rate cut that just met expectations (it was not forcefully dovish) boosted the euro and it finished the week flat vs. the dollar, despite the rate cut. The pound traded similarly, as it was flat on the week absent any major news.

The one notable mover vs. the dollar was the yen, which rose 1.3% vs. the dollar and dropped to a six-month low vs. the greenback (which means the yen got stronger vs. the dollar).

Bottom line: This was largely ignored by the financial media last week but the yen hitting a new one-year “high” (meaning it is the strongest it has been vs. the dollar in a year) will pressure the yen carry trade and just like in early August, this could become a source of volatility in the coming weeks.

Turning to Treasuries, yields hit fresh 52-week lows, again, but the 10-year yield stabilized in the mid-3.60% range and that helped stocks lift late in the week. The firm CPI/PPI data and low claims offset the dovish articles by Timiraos and Dudley (among others).

Bottom line: Stability is needed in the Treasury markets for stocks to lift and that is what we got in the back half of last week. Looking forward, more stability is needed in yields if the S&P 500 is going to test those old highs because a continued decline in yields will just be a louder warning on growth and increase concerns the Fed is behind the curve.

Ready to Navigate These Markets Together?

Schedule your portfolio review to discuss how these market dynamics may impact your allocation strategy.

Schedule Your Review

Disclaimer: The Financial Market Insight is protected by federal and international copyright laws. Vann Equity Management is the publisher of the newsletter and owner of all rights therein and retains property rights to the newsletter. The Financial Market Insight may not be forwarded, copied, downloaded, stored in a retrieval system, or otherwise reproduced or used in any form or by any means without express written permission from Vann Equity Management. The information contained in Financial Market Insight is not necessarily complete and its accuracy is not guaranteed. Neither the information contained in Financial Market Insight, nor any opinion expressed in it, constitutes a solicitation for the purchase of any future or security referred to in the Newsletter. The Newsletter is strictly an informational publication and does not provide individual, customized investment or trading advice. READERS SHOULD VERIFY ALL CLAIMS AND COMPLETE THEIR OWN RESEARCH AND CONSULT A REGISTERED FINANCIAL PROFESSIONAL BEFORE INVESTING IN ANY INVESTMENTS MENTIONED IN THE PUBLICATION. INVESTING IN SECURITIES, OPTIONS AND FUTURES IS SPECULATIVE AND CARRIES A HIGH DEGREE OF RISK, AND SUBSCRIBERS MAY LOSE MONEY TRADING AND INVESTING IN SUCH INVESTMENTS.

© 2024 Vann Equity Management. All rights reserved.

August 2024 Market Insight | Vann Equity Management
Vann Equity Management

Financial Market Insight

📅 August 6, 2024 📊 Monthly Market Analysis 🏛️ Institutional Research

Highlights

Key Takeaways

  • The Growth Scare Is Here (What It Means for Markets)
  • Weekly Market Preview: How Far Can This Pullback Go?
  • Weekly Economic Cheat Sheet: Important Growth Report Today
  • What the Fed Decision Means

The week of August 5, 2024, begins with a major global market sell-off following the Bank of Japan's decision to tighten monetary policy for the first time in three decades. As investors brace for the volatility tsunami impacting a cross-section of risky assets (stocks, credit, commodities), greater uneasiness and a slowing U.S. economy could be enough to prompt the Federal Reserve to adopt a more aggressive schedule for cutting interest rates and loosening monetary policy. As such, we as investors may be given a narrow window to add on market risk if financial contagion does not spread or does the global economy fall into recession.

The interconnectedness of global financial markets means that Japan's financial turmoil could have ripple effects worldwide and exacerbate tightening financial conditions that would impact the funding sources of risk-on position-taking. The sell-off is not only impacting global equities, particularly markets with high-yielding currencies funded in the so-called carry trade. A carry trade is a trading strategy that involves borrowing at a low interest rate and investing in an asset that provides a higher rate of return. A carry trade is typically based on borrowing in a low-interest rate currency and converting the borrowed amount into another currency such as Australia, New Zealand, and Latin America, but also corporate credit risk and commodities.

Despite the recent pullback and selling pressures, the analyst community remains sanguine over earnings prospects, not just for U.S. companies, but for global markets as well. Earnings are expected to grow over the next two years for the major markets (U.S., Japan, Europe, and Emerging Markets) even if that growth trajectory starts to slow down. Near-term liquidity-driven selling could eventually give way to long-term earnings growth reality.

Stocks

S&P 500

  • Technical View: The medium-term trend in the S&P 500 has shifted from bullish to neutral as the uptrend line off the October 2023 lows was violated last week.
  • Dow Theory: Bullish (since the week of July 10, 2023)
  • Key Resistance Levels: 5399, 5479, 5537
  • Key Support Levels: 5302, 5235, 5116

The S&P 500 fell sharply last week thanks to disappointing economic data as the economic growth scare finally arrived and pushed the S&P 500 to multi-week lows.

S&P 500 Weekly Candle Chart

✓ What is Outperforming: Defensive sector, minimum volatility, and sectors linked to higher rates have relatively outperformed recently as markets have become more volatile.

✓ What is Underperforming: Tech/growth and high valuation stocks have lagged as yields have risen.

Market Recap

Domestic stocks attempted to stabilize into the middle of last week as tech earnings suggested Al-driven growth prospects were still intact; however, bad economic data Thursday and Friday led to a resurgence in recession concerns that saw the S&P 500 roll over to end the week down 2.06%. The index is now up 12.09% YTD.

The Growth Scare is Here

The growth scare that our investment team has been worried about finally appeared last week courtesy of the soft ISM Manufacturing PMI and jobs report and the result was a sharp drop in the S&P 500 and a collapse in Treasury yields (to nearly six-month lows). Additionally, on Friday we heard countless mentions across the financial media of recession risks and possibilities.

However, it is important to push back on the emotional anxiety that naturally occurs when stocks drop and the financial media screams trouble. Here is the reality from last week's data: First, for anyone paying attention (as we all have been) last week's data was not a surprise. There have been signs of a loss of economic momentum in various data points for months via economic reports and corporate commentary.

Second, last week's data really was not that bad in aggregate. Yes, the ISM Manufacturing PMI was ugly, but it has been weak for months and was not that much worse than before. Jobless claims and the jobs report, meanwhile, were worse than expected but on an absolute basis, 249k jobless claims is still very low and while July only added 114k jobs, the three- and six-month averages are still very healthy in the high-100k range.

Third, and most importantly, last week's declines are more about the complacency we and others have warned about, not about a sudden, serious deterioration in the data. Two weeks ago, the S&P 500 was trading near 5,600 on a 2024 EPS of $245ish and 2025 EPS of $270ish. That is a 22.8X multiple and a 20.8X multiple, respectively. Those are multiples for perfect environments, i.e., solid (and not slowing growth), explosive earnings growth, and no existential risks (geopolitics, etc.). That is not the environment the market has been in for months and last week the data was bad enough to make the market finally admit it and that is why stocks dropped hard, not because the actual fundamentals turned materially worse (they just were not as good as hoped for and investors finally had to admit it Friday).

Our investment team can confidently say this: If the data were as worrisome as the market implied on Friday, nothing would have been up last week; but plenty in the market was in energy and utilities. If the data were screaming recession, those sectors would not be positive, they would just be down a lot less than everything else.

Looking forward, is a recession that hits stocks hard possible? Absolutely, and that is a risk we are continuing to look at closely. However, suddenly saying a recession is a real risk is about as appropriate as previously thinking one was not possible at all.

Bottom line: The growth scare is here. We are reducing volatility in our equity portfolios via defensive sectors and lower volatile names because we doubt it is over yet. Last week's data just told us, unequivocally, that growth is slowing, and the market finally had to listen. That does not mean a contraction or recession is imminent and as such we do not think de-risking via raising cash is appropriate unless you are sure you can get back in appropriately, because the outlook for this market has not significantly changed as much as the price action implies.

Economic Data (What You Need to Know in Plain English)

Economic data was almost universally disappointing last week, and two of the three major monthly economic reports pointed to an economy now losing momentum and those weak readings spiked economic growth concerns and sent stocks lower and Treasuries higher. The big report last week was on July jobs, and it was the weakest report in a long time. Job adds were 114k, far below the 170k estimate and the lowest number in several years. The unemployment rate, meanwhile, rose to 4.3%, above the 4.1% expectation and the highest reading since October 2021. Perhaps most disconcertingly, the U-6 under-employment rate rose to 7.8% from 7.4%, the highest level in several years.

Bottom line: Labor market indicators have been consistently, albeit slowly, softening for months and it finally showed up in the monthly labor market data as the labor market is clearly slowing in the U.S.

Looking at other data last week, there was only one notable growth report, but it was one of the biggest disappointments of the week, as the ISM Manufacturing PMI declined to 46.8 vs. (E) 48.8, the lowest level since last August. That drop caused a slowdown in concerns to pop and majorly contributed to Thursday's steep selloff. What made the ISM Manufacturing PMI such a bad number was not just the headline, but also the details of the report (which were equally as bad as the headline, if not worse). New Orders, the leading indicator in the report, fell to 47.4 vs. 49.3 previously while the Employment Index declined to 43.4 vs. (E) 49.3.

In sum, this was the worst week for economic data in a long time. To be clear, these numbers do not point to a recession. 4.3% unemployment is hardly awful and jobless claims of 249k would, historically, still be considered good. But the trend in this data is concerning from a growth standpoint and because the market has priced in virtually zero chance of a slower-than-expected economy, the data did spike slowdown worries and hit stocks and boosted Treasuries.

Bottom line: The Fed is clearly telling us they are going to cut in September. Powell also hinted at several rate cuts in 2024. Why? It is not because inflation is so low they can cut aggressively. It is because they are getting worried about growth and this just reinforces what is the key question for markets for the second half of 2024: We know that the Fed is going to cut rates, but will they cut rates in time to avoid a slowdown?

The answer to that question will ultimately determine which direction the next 15% (or more) lies in the S&P 500. From a tactical standpoint, in the short term (meaning the next few weeks) the economy remains in a Goldilocks state of solid growth and looming Fed rate cuts and that should support a milder, but ongoing rotation to Large Cap Value, the "rest" of the market (RSP) and cyclical sectors (small caps, industrials, energy, financials). So, this rotation from tech to the value/cyclical/small caps/RSP can continue given the Fed news.

However, looking beyond the next several weeks, the Fed's increased urgency regarding rate cuts just reinforces our preference for reducing volatility in portfolios via lowering beta. To be clear, the Fed could still stick the soft landing and that is why our investment team does not advocate raising cash.

The Fed is going to cut more because they are worried about growth. The market is not worried about growth at all. That setup does not usually end well in our estimation and as such, we do think it is best to continue to gradually and systematically reduce volatility in our tactical holdings while maintaining long exposure because if we get a growth scare, Fed rate cuts will not be able to stop the correction and high-beta and cyclical will get hit hard.

Ready to Navigate These Markets Together?

Schedule your portfolio review to discuss how these market dynamics may impact your allocation strategy.

Schedule Your Review

Disclaimer: The Financial Market Insight is protected by federal and international copyright laws. Vann Equity Management is the publisher of the newsletter and owner of all rights therein and retains property rights to the newsletter. The Financial Market Insight may not be forwarded, copied, downloaded, stored in a retrieval system, or otherwise reproduced or used in any form or by any means without express written permission from Vann Equity Management. The information contained in Financial Market Insight is not necessarily complete and its accuracy is not guaranteed. Neither the information contained in Financial Market Insight, nor any opinion expressed in it, constitutes a solicitation for the purchase of any future or security referred to in the Newsletter. The Newsletter is strictly an informational publication and does not provide individual, customized investment or trading advice. READERS SHOULD VERIFY ALL CLAIMS AND COMPLETE THEIR OWN RESEARCH AND CONSULT A REGISTERED FINANCIAL PROFESSIONAL BEFORE INVESTING IN ANY INVESTMENTS MENTIONED IN THE PUBLICATION. INVESTING IN SECURITIES, OPTIONS AND FUTURES IS SPECULATIVE AND CARRIES A HIGH DEGREE OF RISK, AND SUBSCRIBERS MAY LOSE MONEY TRADING AND INVESTING IN SUCH INVESTMENTS.

© 2024 Vann Equity Management. All rights reserved.

July 2024 Market Insight | Vann Equity Management
Vann Equity Management

Financial Market Insight

📅 July 16, 2024 📊 Monthly Market Analysis 🏛️ Institutional Research

Highlights

Key Takeaways

  • Market Impact of the Assassination Attempt on Former President Trump
  • Acknowledging There is a Downside to Current Market Events, Too
  • Weekly Market Preview: Do Growth and Earnings Hold Up?
  • Weekly Economic Cheat Sheet: An Important Check on the Consumer This Week
  • Special Reports and Editorial:
  • Is the Rotation from Tech to the “Rest of the Market” Sustainable?
  • Powell Testimony Takeaways
  • Market Multiple Table: An Important Change

Stocks

S&P 500 Chart

The S&P 500 hit yet another record high last week as CPI rose less than expected and boosted investor expectations for a September rate cut and two rate cuts in 2024.

✓ What is Outperforming: Defensive sector, minimum volatility, and sectors linked to higher rates have relatively outperformed recently as markets have become more volatile.

✓ What is Underperforming: Tech/growth and high valuation stocks have lagged as yields have risen.

Market Impact of the Trump Assassination Attempt

Former President Trump survived an assassination attempt by an apparent lone gunman over the weekend. While obviously a troubling event regardless of political affiliation or preference, the market impact of it should be relatively limited because the market already assumes a Trump victory, and potential Republican sweep and the events of the weekend do not reduce those chances, and potentially increase them.

The S&P 500 hit yet another new high last week (the 36th of 2024!) as stocks continued to ride a wave of optimism surrounding three main events:

  1. Impending Fed rate cuts,
  2. Continued disinflation (decline in inflation), and
  3. Expectations for a Republican sweep in the November election.

The “good” scenario of each of those events has been instrumental in sending the S&P 500 through 5,600. First, the Fed rate cuts will reduce pressure on the economy, likely reducing the chances of a hard landing. Second, disinflation will ease the “inflation tax” being paid by consumers, helping to make consumer spending (which is a critical part of the economy) more resilient. Finally, if Republicans sweep, the Trump tax cuts will be extended, and a more pro-business regime will take total power.

All of those outcomes are positive and expectations of them have rightly pushed stocks higher. However, there are negative outcomes from these events, and while we are not going to say they are likely, it would be a mistake for investors to simply assume there is no potential drawback to these events because there is a negative consequence for each of these that we must consider.

Reviewing these same points as above, fed rate cuts will reduce the headwind on the economy, but it is the “why” that matters. Is the Fed cutting rates because growth is slowing more than they anticipated? Slowing growth can be a major negative for markets and despite investor enthusiasm, rate cuts are not a guaranteed market positive event.

Second, disinflation does reduce headwinds on consumer spending; however, it can also reduce corporate earnings! The pandemic inflation has been a blessing to S&P 500 earnings, as consumers simply digested the price increases, boosting both revenue and margins across industries! However, inflation is now falling because 1) Supply chains have normalized and 2) Because the consumer is pulling back (less demand). Falling prices can compress margins and reduce revenue and we have seen evidence of that occurring across earnings recently (NKE and WBA a few weeks ago, DAL/CAG/PEP last week). Disinflation is a macroeconomic good, but it can also place downward pressure on earnings, which would be a negative for stock prices.

Finally, whether it is historically accurate, (the jury is out based on index performance) markets think Republican governments are positive for stock prices and ever since Biden’s poor debate showing, markets have been increasing expectations for a Trump win and a Republican sweep of the House and Senate. However, Trump is not a typical Republican. His stated tariff agenda risks a new trade war that will have unintended and unknown consequences (which could be bad). Additionally, debts and deficits will matter in the coming years. The Trump tax cuts may be extended if Republicans win, but if global bond markets do not see moves by the government to address the U.S. fiscal situation, Treasury yields could rise despite slowing growth, creating a vise for consumers and companies.

Economic Data (What You Need to Know in Plain English)

Market Drivers Table

Fed rate cuts, falling inflation, and a Republican sweep are probably good for stock prices and the economy; however, they are not guaranteed good (and they could, in fact, be bad). Moreover, the market at these levels is ignoring the possibility these events are not positive. Our investment committee does not want to ignore these possibilities when we are thinking about current exposure, levels, etc. So, we are pointing them out here to make sure we keep ourselves grounded amidst this bubbling market euphoria.

Bottom line: Clearly the momentum in markets is higher and this is, currently, a Goldilocks environment for stocks. Yet the market continues to reek of complacency regarding some very substantial changes in macroeconomic forces compared to the past several years, and while our investment team sincerely hopes they all work out positively, we must acknowledge the downside of these events as well, because we will not get blindsided (as some advisors and investors will be) should one (or more) of these events not be as positive as currently expected.

CPI was the key report so far this month and it beat expectations, further signaling disinflation is ongoing and, most importantly, likely solidified the Fed will cut rates in September and kick off a rate cutting campaign.

The focus will turn to growth this week and while none of the data is from the major monthly reports, all growth data matters (especially given the Fed is about to start cutting rates) so that we can learn, as early as possible, if rate cuts will be enough to prevent a stall or contraction in the economy. Put simply, the chorus of economic data that has been pointing to a loss of momentum has grown louder over the past month and if that continues, growth concerns will creep higher.

The most important economic report this week is Wednesday’s June Retail Sales. The U.S. economy is a consumer-driven economy and put simply, if the consumer pulls back, the chances of a hard landing will rise. Retail spending has been, at best, plateauing lately and if that plateau turns into an outright decline or contraction, it will be an incremental negative for markets.

The next most important report will be the Empire Manufacturing Index and the Philly Fed Survey. These are the first data points of every month so they will give us the first look at July activity. Now, these metrics have been volatile, to put it generously, but they still matter in a broad sense of are they getting better, worse or about the same? Both have been largely about the same, showing a modest contraction in manufacturing in both regions in recent months and if that gets better, it is a mild positive. If it gets worse, it is a negative.

Bottom line: Growth has mattered all year and with the Fed rate cuts now known, it matters even more because it brings us closer to answering the question: “Did they cut in time?”—and the data will tell us.

Commodities, Currencies & Bonds

Commodities declined modestly last week despite a weaker U.S. Dollar, as global growth worries weighed on oil while gold saw a modest rally thanks to the lower dollar.

Gold Weekly Chart

Gold was little changed through the front half of the week before lurching towards record highs on Thursday thanks to the cool June CPI data and the resulting combination of firming Fed rate cut expectations for the months ahead and rising confidence in the economy achieving a soft economic landing this year.

The Dollar Index declined again last week following the better-than-expected CPL report, as markets more fully priced in two rate cuts in 2024.

The better-than-expected CPI report was the main catalyst for markets last week and the result was as you would expect: A weaker dollar and lower Treasury yields.

For now, falling rates remain positive for stocks but as we and others keep saying, falling yields will only stay positive for stocks until a certain point (Our team pegs that around 3.75%, but it could be a bit higher or lower). However, if the 10-year yield falls towards and through 4.00%, that will be a clear signal from investors they are getting more worried about growth—and at that point, falling yields will transition to a negative signal. So, the more the 10-year Treasury yield is stable between 4.00%-4.25%, the better for stocks.

10-Year T-Note Yield Chart

Treasury yields declined moderately last week as the smaller than expected increase in CPI pressured yields, and the 10-year fell back into the 3.75% - 4.25% ‘stock positive’ range.

Special Reports and Editorial

Is the Rotation from Tech to the “Rest of the Market” Sustainable?

By far the biggest impact of last week’s CPI report was the massive rotation out of tech and tech-related sectors (tech, consumer discretionary, communication services) and into sectors that are 1) More sensitive to lower rates and 2) Cyclical in nature. This is best exemplified by the fact that the Russell 2000 surged almost 3.6% Thursday while the Nasdaq 100 dropped 2%, resulting in a massive 6% swing in their relative performance. But even considering that massive 6% swing, the Nasdaq is still outperforming the Russell 2000 by 15% YTD and that just underscores how badly cyclical and lower-rate-sensitive sectors have performed compared to AI-driven tech.

Further evidence of this rotation can be seen in the sector trading, as the only sectors to decline meaningfully were tech, consumer discretionary, and communication services (all tech and AI-related sectors). Consumer staples (XLP) declined 0.55% but that was because of disappointing earnings from Pepsi (PEP) and Conagra (CAG).

Every other sector in the S&P 500 traded solidly higher, led by real estate (XLRE) and utilities (XLU), which gained 2.7% and 1.8%, respectively. The reason for the rallies was clear: Those sectors have large dividends and stand to benefit if rates are now on a sustainable path lower. Similarly, small caps (IWM) also benefit from lower rates (again the Russell 2000 rose 3.6%). Other sectors that were higher included: materials (XLB up 1.4%), industrials (XLI up 1.3%), and energy (XLE up 1.3%). Those sectors are all cyclical, in that they do well when economic growth is accelerating, and, for Thursday at least, investors embraced the idea that a sustainable decline in rates will lead to more resilient growth and cyclical can do well.

So, can the sectors that led markets Thursday continue to outperform? In the near term, yes. The performance gap between tech and the rest of the market is so wide that it is reasonable to expect continued closing of that gap as markets more fully embrace the idea of the start of a rate-cutting cycle.

However, for this rotation to be sustainable beyond just a few weeks (and instead into the fourth quarter and end of the year) economic growth must remain resilient and we cannot have a growth scare. If we do have a growth scare, then cyclical sectors such as energy, industrials, materials, and financials will likely not do well (although defensive sectors such as utilities/REITs/staples and healthcare should relatively outperform).

So, whether one thinks this rotation and the “rest” of market outperformance can continue depends on one’s opinion on growth.

Because our investment team is more concerned about growth than the consensus, we are not inclined to think this cyclical/rest-of-market outperformance can continue and as such, we are not chasing value/cyclicals here.

Powell Testimony Takeaways

Fed Chair Powell testified before congress last week and there were two notable takeaways from his comments. First, Powell continued to say that all the Fed needs is some more “good” inflation data to be in a position to cut rates. That is dovish on its face, but it is also the same thing he has been saying for the past month-plus, and since a September rate cut currently has an 80% expectation from the market, that comment merely reinforced what is now widely expected, and as such it did not really move markets.

Second, if you read between the lines of Powell’s comments, it is clear the Fed is focusing on slowing growth, while the market still is not. Powell made several small comments to reflect this reality, including some comments on cooling in the labor market and again referring that risks to the outlook are balanced between inflation and growth. Yet perhaps the most notable comment was that inflation, “is not the only risk we face.”

We view Powell’s commentary as reinforcing our concern that the market is complacent to growth risks. That does not mean we are predicting a recession because we are not; however, we do think the chances of a growth scare continue to rise, and at this point, there is a growing disconnect between what the Fed is worried about (growth) and what the market is worried about (nothing, other than AI earnings).

Market Multiple Table: An Important Change

For much of 2024, the S&P 500 has been trading solidly above any fundamental justified valuations, as a combination of rate cut hopes and AI earnings pushed the S&P 500 to the very limits of forward valuations. But the “market multiple” math just got a bit easier for the bulls, because around July of each year, analysts switch their earnings expectations from the current year to the next year, and in doing so the July Market Multiple Table now shows this market, at these levels, is reasonably valued as long as 2025 earnings estimates are correct!

To be more specific, consensus S&P 500 earnings for 2025 are around $270/share, solidly higher than the $243 estimate for 2024. And while this upcoming earnings season can change those numbers, for now, they are intact and as a result, the “fair value” of the S&P 500 using next year’s earnings has now leaped to the mid-5,000 range.

Importantly, this is not just a bookkeeping formality. Analysts value the market based on next year’s earnings and “next year” is now (or soon will be) 2025 earnings and based on those metrics, while the market is not cheap, it is no longer wildly above fundamental valuations (as it was before).

This change impacts investors in two ways. First, it does not remove the risk of a correction or pullback. Markets are still aggressively optimistic about a soft landing, aggressive Fed rate cuts, and resilient earnings. The net result is a high multiple (still around 20X). If growth slows more than expected or earnings fall, this market will drop.

Second, this earnings shift does make the YTD gains “stickier” in the event of a mild pullback. Put differently, current S&P 500 levels are a lot more justifiable using 2025 EPS (which is legitimate now). So, it is going to take real, negative news to cause a meaningful pullback in stocks (like a growth scare, fewer Fed rate cuts, geopolitical surprises, or AI disappointment).

Bottom line: The stock market has been trading at very aggressive valuations for much of 2024 and the change in earnings makes current market levels more justifiable. Additionally, it opens a credible path to another 5%-10% rally. However, the facts have not changed regarding the risks facing this market, and if there is legitimate negative news on one of the four market influences, a drop of 5% is possible. If there is a negative turn in multiple market influences, a drop of 10% or more is not just possible, it is likely.

Current Situation: Growth is slowing but not too slow and a soft landing is still expected, Markets widely expect the Fed to cut in September and twice in 2024, AI enthusiasm remains high, and geopolitical risks have eased slightly over the past month. The current situation reflects an environment that is still broadly supportive of stocks (and deserves a high multiple), but it is also leaving investors extremely vulnerable to a growth scare given that high multiple and recently soft economic data. And while the outlook for stocks is positive this market is still very aggressively valued given the current macroeconomic reality and at risk of a sudden, sharp pullback.

A Game of Multiples Table

Things Get Better If: Economic data stabilizes, the Fed confirms a September rate cut, AI tech companies continue to beat earnings, and geopolitical risks decline. This would reflect a “perfect” environment for stocks of 1) Solid economic growth (so no slowdown), 2) Continued upward pressure on earnings expectations thanks to AI stocks, 3) Near-term rate cuts, and 4) Declining geopolitical risks. This environment could justify a 22X multiple in the markets (and 21X at least), which means “fair value” for the S&P 500 in this scenario is in the upper 5,000s.

Market Multiple Levels Chart

Things Get Worse If: Economic data gets worse and points to a slowdown, AI-related tech companies miss earnings, the Fed pushes back on a September rate cut and geopolitical risks rise. This scenario would essentially undermine the assumptions behind much of the October-present rally and a giveback of much of the October-to-present rally would not be out of the question (that means a decline into the low 4,000s in the S&P). And while it seems like this outcome is not possible given still-elevated valuations, none of this is set in stone and this is a legitimate scenario we need to be mindful of, because it is possible if data breaks the wrong way.

Ready to Navigate These Markets Together?

Schedule your portfolio review to discuss how these market dynamics may impact your allocation strategy.

Schedule Your Review

Disclaimer: The Financial Market Insight is protected by federal and international copyright laws. Vann Equity Management is the publisher of the newsletter and owner of all rights therein and retains property rights to the newsletter. The Financial Market Insight may not be forwarded, copied, downloaded, stored in a retrieval system, or otherwise reproduced or used in any form or by any means without express written permission from Vann Equity Management. The information contained in Financial Market Insight is not necessarily complete and its accuracy is not guaranteed. Neither the information contained in Financial Market Insight, nor any opinion expressed in it, constitutes a solicitation for the purchase of any future or security referred to in the Newsletter. The Newsletter is strictly an informational publication and does not provide individual, customized investment or trading advice. READERS SHOULD VERIFY ALL CLAIMS AND COMPLETE THEIR OWN RESEARCH AND CONSULT A REGISTERED FINANCIAL PROFESSIONAL BEFORE INVESTING IN ANY INVESTMENTS MENTIONED IN THE PUBLICATION. INVESTING IN SECURITIES, OPTIONS AND FUTURES IS SPECULATIVE AND CARRIES A HIGH DEGREE OF RISK, AND SUBSCRIBERS MAY LOSE MONEY TRADING AND INVESTING IN SUCH INVESTMENTS.

© 2024 Vann Equity Management. All rights reserved.

“August 2025 Investment Insights: Inflation, Fed Rate Cuts, Commodities, and the Future of AI”

August 2025 Market Insight | Vann Equity Management
Vann Equity Management

Financial Market Insight

📅 August 20, 2025 📊 Monthly Market Analysis 🏛️ Institutional Research

Highlights

Key Takeaways

  • Two Events That Could Actually Cause a Pullback
  • Weekly Market Preview: All About the Fed (Does Powell Signal a September Cut on Friday?)
  • Weekly Economic Cheat Sheet: Important Growth Updates This Week (Do They Push Back on Stagflation Worries?)
  • What Happens if AI Starts to Lose Momentum?
  • The Hot PPI Threatens Multiple Pillars of the Rally

Stocks

S&P 500 Chart

Stocks rallied last week despite hotter-than-expected inflation data (in total) and some disappointing tech/AI earnings, as stable growth and still-high expectations for Fed rate cuts powered stocks to new all-time highs.

✓ What is Outperforming: AI-related tech, cyclical sectors, small caps.

✓ What is Underperforming: Defensive sectors, energy.

Two Events That Could Actually Cause a Pullback

The S&P 500 has pushed to new all-time highs month-to-date, even as the flow of news has been more negative than positive. Inflation metrics remain stubborn: CPI was mixed but still above the Fed’s 2% target, while PPI came in hot. Corporate earnings in the AI sector were also uneven—AMAT issued soft guidance, and both C3.ai (AI) and Core Weave (CRVW) sold off sharply. Geopolitical tensions persist, and expectations for Fed rate cuts have been trimmed, though markets still broadly anticipate a September cut.

Despite these headwinds, equities rallied. The reason: none of the data was severe enough to shake investor conviction in the two drivers of this market:

  1. Tariffs will not trigger stagflation (a toxic mix of weak growth and high inflation).
  2. AI enthusiasm remains intact as a growth engine for earnings and valuations.

Last week’s news did, however, inch toward those risks. With hot inflation raising the possibility that tariffs could fan price pressures, and AI earnings were disappointing, but neither development was dramatic enough to alter the prevailing narrative. Markets effectively shrugged them off.

Bottom line: There is plenty of noise—conflicted inflation data, questions about data accuracy, geopolitics, and AI momentum. But cutting through it all, investors are really asking two questions:

  1. Has the likelihood of tariff-driven stagflation increased materially?
  2. Has AI optimism been seriously undermined?

So far, the answer to both remains “no.” As long as that holds, volatility is possible, but the market trend should remain higher.

Economic Data (What You Need to Know in Plain English)

Economic Data Chart

August was squarely on inflation, and the data delivered a rollercoaster ride for investors. CPI came in relatively tame, sparking optimism for Fed rate cuts and pushing the S&P 500 to fresh all-time highs above 6,400. But enthusiasm was quickly checked by a much hotter-than-expected PPI report, which erased some of the gains and reminded investors that the path to lower inflation remains uneven.

Starting with the Consumer Price Index (CPI), the headline number was encouraging, rising 2.7% year-over-year versus expectations of 2.8%. Core CPI, however, increased 3.1% compared to estimates of 3.0%. While that core reading was hotter, markets largely looked past it. The upward pressure was concentrated in services categories like dental care and airfare (areas that are not tied to tariffs and therefore less relevant to the broader inflation debate). As a result, CPI was interpreted as easing inflation worries, and markets moved to full price in the September Fed rate cut, fueling last week’s rally.

The Producer Price Index (PPI), however, told a different story. PPI surged 0.9% month-over-month (vs. expectations of 0.2%) and 3.3% year-over-year (vs. 2.5% expected, and up from 2.4% the prior month). Like CPI, the strength came from services, airfare, cable, and internet in particular. However, unlike CPI, the surprise was too big to dismiss. While it did not cause a sustained selloff, it did pull markets back from their highs and highlighted that inflation risks remain.

The key takeaway is that neither CPI nor PPI showed meaningful evidence of tariff-driven goods inflation, which is the real concern for stagflation. For now, markets remain confident that the Fed will cut rates in September and again in December, with a possible October cut still on the table. Nonetheless, the outlook will hinge on the next three major inflation readings (Core PCE, CPI, and PPI), which will set the tone for the remainder of the year.

On growth, the story was steadier. July retail sales were a touch light on the headline (0.5% vs. 0.6% expected), but June was revised higher, and the “control” group beat expectations with an upward revision. The data confirmed that consumer spending remains resilient, countering fears that the economy is slipping toward stagflation.

Looking ahead, we are looking for clarity from the Fed. Chair Powell’s speech at Jackson Hole on Friday, 08/22/2025, is the most important event, though it is notoriously difficult to predict whether he will address monetary policy directly. A signal toward a September cut would be well received, while a pushback, or silence, could pressure markets. In addition, the release of July FOMC minutes will be closely watched after two officials dissented in favor of a cut, the most since the early 1990s. If the minutes suggest broader support for easing, markets will likely interpret that as dovish. Finally, Thursday’s flash PMI for August will provide the first major read on growth this month, and the stronger the number, the more it will calm lingering stagflation fears.

Bottom line: August remains a month defined by the tug-of-war between inflation, Fed policy expectations, and growth. Last week’s data kept the hope of near-term rate cuts alive while reminding investors that risks have not disappeared. As long as confidence in Fed easing and consumer resilience holds, the market’s momentum should remain intact.

Commodities, Currencies & Bonds

Commodities were mostly lower last week as economic data continued to point to rising stagflation risks, a negative for growth-sensitive energy futures, while hot inflation data in the back half of the week weighed on gold.

Commodities Chart

Commodities were mostly lower in August as gold pulled back from record highs and oil slid to multi-month lows. The move was driven by a hot PPI report, easing geopolitical fears, and renewed questions about demand. Copper continued to churn sideways after July’s historic collapse, leaving broad weakness across energy and metals. The commodity ETF (DBC) fell 0.32% for the week.

Energy: Oil was in focus as optimism for a ceasefire between Russia and Ukraine, encouraged by pressure from the Trump administration, reduced the geopolitical risk premium that has supported prices since 2022. A soft EIA report added to the pressure, sending WTI to its weekly lows before stabilizing into the weekend. WTI continues to face downside risk toward $60/barrel. A break below that level could trigger a test of 2025 lows near $55, while upside resistance remains heavy between $65–$70 unless a fresh geopolitical shock emerges.

Precious Metals: Gold looks to be in a basing pattern after significantly higher moves over the last several months. While the long-term uptrend is intact, momentum has cooled, leaving gold vulnerable to further pullbacks if the dollar strengthens or the Fed leans hawkish.

Currencies: The Dollar Index closed below 98 for the first time since mid-July as markets priced in a September Fed cut. Overall, a stable dollar in the mid-to-upper 90s is neutral for stocks and should not disrupt equity momentum.

Treasuries: The 10-year yield remains in the 4.20%–4.30% range, remaining broadly neutral for equities. A gradual drift toward 4.15% would support stocks, while a move toward 4.50% would become a headwind. This week, Powell’s Jackson Hole speech and incoming data will be the key drivers for bond markets.

Bottom line: Commodities have softened, the dollar is lower, and Treasuries stay range-bound as markets balance inflation fears with Fed cut expectations. The picture remains one of consolidation rather than breakdown, with the Fed’s next signals likely to dictate whether these trends extend or reverse.

Special Reports and Editorial

Special Report Chart

What Happens if AI Starts to Lose Momentum?

While most of last week’s attention was on CPI and Fed policy, two high-profile AI bellwethers posted disappointing results. C3.ai (AI) dropped 25% after soft guidance, while Core Weave (CRWV) fell 21% following weak earnings. Those sharp declines raise an important question: What happens to this market if AI loses momentum?

It is easy to focus entirely on tariffs, inflation, and economic growth, but history reminds us that markets can falter even when the economy holds up. During the dot-com bubble, for example, the S&P 500 lost more than 20% between March 2000 and August 2001, despite unemployment rising modestly from 4.0% to 4.6%. The economy remained broadly stable until the combination of the tech bust and September 11th finally tipped it into recession. In other words, the bursting of tech enthusiasm itself was enough to drag markets down.

The parallel matters now. The current rally has been disproportionately fueled by AI-linked mega-cap stocks. Five names (NVIDIA, Microsoft, Meta, Broadcom, and Palantir) account for about 6% of the S&P 500’s 9.7% year-to-date return, or roughly 60% of the index’s gains. More broadly, the Information Technology and Communication Services sectors together make up two-thirds of the rally.

Bottom line: The market is acutely vulnerable to a loss of enthusiasm in AI. Even if the broader economy remains resilient, whether in a soft-landing or stagflation-light scenario, a slowdown in AI momentum would represent a real headwind for equities. The declines in C3.ai and Core Weave serve as reminders that execution, not just narrative, now matters for AI companies, and by extension, for the market as a whole.

The Hot PPI Threatens Multiple Pillars of the Rally

The July Producer Price Index (PPI) surged by the most since March 2022, rising more than four times the consensus estimate. That surprise matters because it threatens several of the “pillars” currently supporting the 2025 stock market rally.

Pillar 1: Inflation Is Widely Expected to Return to the Fed’s 2% Mandated Target
Markets have been priced for inflation to steadily move back toward the Fed’s target. Historically, PPI leads CPI, so if July’s spike is the start of renewed wholesale price pressures, history suggests consumer inflation could reaccelerate within two to six months. That outcome is not reflected in record-high stock prices.

Pillar 2: The Fed Is Expected to Resume Rate Cuts in September
The expectation of resumed rate cuts this fall rests on inflation staying contained. But if PPI proves to be an early warning of hotter CPI, the Fed faces a dilemma: support a weakening labor market (as July’s jobs report suggested) or hold off on easing to fight inflation. Either way, higher inflation reduces the case for near-term rate cuts—the second key pillar of this rally.

Pillar 3: Corporate Earnings Are Seen Growing Solidly into 2026
Corporate guidance during Q2 built confidence that earnings growth would remain strong into next year. But higher producer prices mean rising input costs, which could compress margins. If companies pass those costs to consumers, it feeds back into inflation, threatening both corporate earnings and the Fed’s ability to cut rates.

Bottom line: The July PPI report represents more than a one-off surprise. It directly challenges expectations for falling inflation, steady Fed easing, and resilient earnings—all of which underpin the current market rally. With the S&P 500 trading at 22x 2026 earnings estimates, any shift toward stagflation in the back half of 2025 would leave equities looking stretched.

Ready to Navigate These Markets Together?

Schedule your portfolio review to discuss how these market dynamics may impact your allocation strategy.

Schedule Your Review

Disclaimer: The Financial Market Insight is protected by federal and international copyright laws. Vann Equity Management is the publisher of the newsletter and owner of all rights therein and retains property rights to the newsletter. The Financial Market Insight may not be forwarded, copied, downloaded, stored in a retrieval system, or otherwise reproduced or used in any form or by any means without express written permission from Vann Equity Management. The information contained in Financial Market Insight is not necessarily complete and its accuracy is not guaranteed. Neither the information contained in Financial Market Insight, nor any opinion expressed in it, constitutes a solicitation for the purchase of any future or security referred to in the Newsletter. The Newsletter is strictly an informational publication and does not provide individual, customized investment or trading advice. READERS SHOULD VERIFY ALL CLAIMS AND COMPLETE THEIR OWN RESEARCH AND CONSULT A REGISTERED FINANCIAL PROFESSIONAL BEFORE INVESTING IN ANY INVESTMENTS MENTIONED IN THE PUBLICATION. INVESTING IN SECURITIES, OPTIONS AND FUTURES IS SPECULATIVE AND CARRIES A HIGH DEGREE OF RISK, AND SUBSCRIBERS MAY LOSE MONEY TRADING AND INVESTING IN SUCH INVESTMENTS.

© 2025 Vann Equity Management. All rights reserved.

April 2025 Market Insight | Vann Equity Management
Vann Equity Management

Financial Market Insight

📅 April 7, 2025 📊 Monthly Market Analysis 🏛️ Institutional Research

Highlights

Key Takeaways

  • Important Read
  • Bull vs. Bear: Which Argument Makes More Sense?
  • Market Preview: Will There Be Any Tariff Relief?
  • Economic Cheat Sheet: Focus Turns to Inflation (CPI on Thursday)
  • What the Tariff Announcement Means for Markets
  • The Bull Case vs. the Bear Case Post Tariffs

At the time of writing this, Monday morning Futures are sharply lower again (down close to 2%) as there was no meaningful tariff relief over the weekend while administration officials reiterated their support for the current tariff policy. The stock market got absolutely pummeled last week thanks to a material escalation in the global trade war initiated by President Trump’s tariff announcement that shocked us and the markets with much larger than expected tariffs. Stagflationary¹ economic data did not help either, and when the dust settled last Friday the S&P 500 plunged 9.08% for the week and is now down 13.73% YTD.

So far, tariff concerns do not appear to have significantly impacted U.S. economic activity. Most real‑time barometers of GDP growth have decreased, but only slightly. Earnings estimates generally have held up; but we have seen an enormous increase in business uncertainty. This means the potential impact could dwarf what was seen in 2017. Then, the effective tariff rate that the U.S. imposed on all imports only rose from 1.6% to 3.1%. However, this time around, even if deals are made with numerous trading partners, the effective tariff rate is likely to be substantially higher. The measures announced by President Trump on April 2nd would move the rate above 20%, even higher than the peak levels seen in the 1930s. Trade uncertainty is higher than at any time since at least the mid‑1980s; and one widely followed index of economic policy uncertainty has spiked to a level previously only eclipsed at the height of the COVID pandemic.

The bottom line is that higher tariffs pose a significant risk to the current economic outlook. While this risk may ultimately prove to be temporary, we think concerns are likely to get worse before they get better; but they ultimately will get better. Depending on where tariffs end up over the next 6-12 months will determine to what extent inflationary pressures will be transitory or more persistent. The market is currently begging and screaming for clarity around growth and inflation; but fiscal policy is now playing a game of chicken with the entire world trade economies and our Fed. We think many countries will cave in this game, but one thing for sure is that the US Fed is waiting to see more before making any decisions on rate moves; which may now become a foregone conclusion for any hope at a soft landing.

As a result, businesses and consumers appear to be putting some major spending decisions on hold. If this level of uncertainty persists, a U.S. recession—and, probably, a global one as well—are the most likely outlook.

The Important Read

From the individual investor to the experienced fund manager, we are all looking at red across the financial screens, every investor's mind is focused on this one question. Markets are crashing, fear is everywhere, so what does the savvy investor do now? Fear is invading portfolios, distorting judgments, and dragging some of the more experienced investors off track. Every member of our investment team and many of our long-term clients have seen this before, in 2000, 2008, and 2020. And for the long-term investors, we have always made it through, and the market has ended up higher than where we started. Now while on the surface each collision seemed distinct, but beneath each bear market ran the same emotional script: panic first and opportunity second. A time during which history discreetly reveals a pattern for those with selectivity and discernment, the headlines exude a sense of impending doom.

Here is what to know:

The Nature of Fear in Markets—It Distorts Reality

Fear makes smart investors emotional ones. It substitutes survival instinct with solid planning, and regardless of experience, anxiety whispers that this time may truly be different when the market declines rapidly and hard.

We have seen this script before. The dot-com bubble broke in 2000, therefore eradicating ideas of infinite expansion. The financial crisis tore confidence in institutions in 2008. In 2020, a virus crippled global markets in a matter of months. Every moment set off the same response: broad panic, indiscriminate selling, and a dash to safety; which usually comes too late; and each event was followed by a significant market recovery.

"Short run, the market is a voting machine," Warren Buffett said. Long-term, the market functions as a weighing machine. Most investors overlook the fact that anxiety, when it gets louder, becomes a major sign of forced selling. That is not a justification for running. It motivates one to start working.

Common Investor Fears During Crashes

Rational thinking gives place to emotional survival when markets collapse quickly. Fear takes over control; it does not simply occupy the room. We have observed the same repeating worries afflicting investors during every significant downturn, and every time these are the questions that we get asked:

  • “Am I going to lose everything?” Most extreme fear generates this question; but the answer is Rarely does it ever capture reality. A downturn is volatility, not finality; it is not a catastrophic loss unless you are overleveraged or focused on structurally flawed assets. These are none of our clients.
  • "It is different this time…." Every crash in the moment seems unheard of. Beneath the headlines, though, the causes are usually excess, leverage, and false expectations and they become painfully known. Many times, believing "this time is different" results in the rejection of tried-for solutions. We have a quantitative process that has generated decades of positive returns over a market cycle. Likely now after the decline many forecasters will jump on the fear wagon and advocate further downside. 10%-20% is a normal correction and we are well within that tolerance.
  • “Should I sell now and buy back lower?” This is an illusion with peril. Accurately timed market movements rely more on chance than skill. Most who try end up buying back at more expensive rates, selling low, and missing the recovery. We do not try to time the markets, we let earnings dictate the direction of our portfolios.
  • "Am I missing better prospects somewhere else?" One develops a dread of missing out and then worries about being left behind. Often hunting safer assets already overvalued, investors migrate out of quality into comfort.

They are behavioral traps, loss aversion, recency bias, and herd mentality that drive investors into emotional decisions, irreversibly damaging capital. The long-term winners are the ones that interpret fear as a signal, not as a justification.

The Practical Response

When markets fall, most investors react, but really, they should reassess and make sure they have a process or have a financial advisor that owns a process. Every position in the Vann Equity Management portfolios begin with quantitative metrics and a qualitative catalyst. During times of volatility our team stops and goes back over each and every thesis of every holding instead of panicking. We ask ourselves, “Has the plot changed?” “Has the brink vanished?” “Should we not hold or double down?” If so, we cut it quickly and redistribute it. Our process does not sell on dread. We sell when the sales, earnings, margin or thesis disappear. It is very rare that once cash is raised the individual investor will jump back into the market anywhere near where the bottom is…. Therefore, missing the recovery and locking in unnecessary losses.

Opportunity quantitative screening, not the comfort of cash will win the game of long-term. Volatility causes mispricing. That is when we search for spinoffs, insider-heavy turnarounds, restructurings, and dislocations—that is when we run the most aggressive of our screening process. History supports this: in the twelve months following significant market lows, the S&P 500 has averaged over thirty-five percent. The secret is to use the data and draw from experience.

Live by Smart Money - Insiders buying amid a crisis are not guessing; they are expressing certainty. We monitor management changes, insider buying trends, and dropped spinoffs often missed by other institutional investors. These are choices supported by data, not emotional ones.

The Power of Process Over Panic

In falling markets, the process serves as the shield while emotion is the enemy. There should be no guessing. Volatility sharpens our research-driven, quantitative-led approach; it does not disturb it. Others rush for comfort or cash, but Vann Equity Management follows discipline: spotting dislocations, verifying catalysts, and precisely allocating within the equity markets. This process is about adapting to what is working, not working, and what will work; not about forecasting the bottom. Every crisis we have negotiated has made us more careful, more focused, and surer of our capacity to identify value when the noise level is highest. Anxiety vanishes. Process lives.

Remember, it is time in the market; not timing of the market that accumulates true wealth.

What You Should Do Now

Some investors seek an exit when fear rules the market. The brighter one’s search for opportunities. If you only learn one lesson from this month’s issue, let it be this: sell a portion of your equity portfolio up to 25% if you are retired and need ALL of your money and plan to only live the next five years, but do not sell if it is simply because you are afraid. There is a difference.

At Vann Equity Management, our investment team pays more attention to what is misinterpreted than to what is falling. This is the time to monitor insider buying since, although the public withdraws, insiders are often acting with conviction rather than emotion. This is also the moment to hone our attention to spinoffs, restructurings, and businesses experiencing true internal transformation rather than merely following what seems low-cost. We are using this crash to construct a future-oriented portfolio rather than to fix a faulty one. The market will bounce back, as it always does, but only those who used the drawdown sensibly will stand ahead. Get ready to observe the process. Relax. See the panic as an advantage. Understand we have a repeatable, not reactive, approach that will help you be more suited for what lies ahead than merely surviving what is now.

Final Words

Panic is noise. You are supposed to pick up the signal. Do not herd like others. When others pause, look for mispriced opportunities, separate actual triggers, and act with confidence. While bad judgments do, crashes do not kill investors. Process, patience, and preparation set long-term winners apart from the rest, not luck or timing. If you do need cash and cannot withstand the volatility, please reach out, and let us open another account and decide what amount of cash is right for you to move to the sidelines; based on your individual and family needs, not fear.

Stocks

S&P 500 Chart

Stocks collapsed last week as the Trump administration’s reciprocal tariff announcement was much worse than feared and the S&P 500 plunged on Thursday and Friday to fresh YTD lows.

✓ What is Outperforming: Defensive sectors, minimum volatility, and sectors linked to higher rates have been relatively outperformed recently as markets have become more volatile.

✓ What is Underperforming: Tech/growth and high valuation stocks have lagged as yields have risen.

Bulls vs. Bear: Which Argument Makes More Sense?

The bullish argument is: 1) It is not a total washout (the S&P 500 is down sharply but defensive sectors and minimum volatility factors are only down modestly), 2) The Trump Put still exists and 3) The “worst-case” tariff news is now known, and a large wall of worry has been constructed.

The bearish argument is: 1) It is the 1970s again (rampant stagflation driven by a huge policy error), 2) The market is still overvalued and 3) The Trump Put exists but may be in the low 4,000s in the S&P 500.

In the short term, the bearish argument takes it with ease, because the bullish argument is extremely weak in the near term. Essentially, the bullish argument is based on the logic that 1) It cannot get any worse on tariffs, 2) It is all still a negotiation and 3) Eventually Trump will see the error of his ways. The problem with that is it can always get worse (retaliation) and that means a possible constant drip of more tariff threats in the coming weeks.

At this point, even optimists have to doubt the “negotiation” tactic as nothing has been negotiated lower in four months of tariff threats. Then, waiting for Trump to admit an error and change could be an expensive position. Bottom line, the near-term outlook for markets is not good and even if there is tariff reduction this week, we should expect continued volatility after a short-term bounce.

So, why are we not declaring this a bearish game changer?

Because the bullish argument is more compelling in the medium/long term (three-to-six months and beyond). The simple truth is the U.S. economy is stronger than the shock. This policy will either work (which would be very unexpected and defy the known laws of economics) or the pressure from the economy will force the change, either with the president making that change, or the Congress, or election results forcing him to do it. Additionally, unless this policy is a total success, we would be shocked if, within the next two years, the presidential ability to levy tariffs is not removed and requires Congressional approval (something akin to the War Powers Act, only for tariffs).

Bottom line: in the near term we do think it makes sense to continue to hide in defensive and low-volatility equities in our portfolios. However, if these tariffs stay in place for an extended period and the S&P 500 does fall another 10%-20%, our team believes that will present a substantial long-term opportunity. So, while we do not hope that happens, we do think this disruption will present another long-term buying opportunity.

Economic Data (What You Need to Know in Plain English)

Tariffs obviously dominated the market narrative last week but while there are valid economic concerns moving forward, the reality is that March economic data was mostly “fine” and that while the U.S. economy may be losing some forward momentum, the major reports did not show a sudden drop-in activity. Put plainly, U.S. economic data is not that bad and if it were not for tariffs, this week’s data would have been perfectly Goldilocks.

Inflation will come back into focus this week, and we will also get some important updates on growth. Given last week’s tariff announcements, any data that points to stagflation will only add to the already considerable, near-term market headwinds.

Bottom line: This market needs some good news and the sooner the better. Benign CPI readings and better-than-expected jobless claims will not erase stagflation concerns (especially since the impact of tariffs will not show up fully in the data until April and May) but it will push back against them; and at this point, even that could help stocks stabilize.

Special Reports and Editorial

What the Tariff Announcement Means for Markets

Last week’s tariff announcement fell under our “worse-than-feared” scenario as President Trump announced a 10% baseline tariff for all imports and dramatically higher tariffs for major trading partners including China and the EU, which saw the imposition of 34% and 20% tariffs, respectively.

Regarding the belief that reciprocal tariffs are tools to usher in global tariff reduction, that door was left open by the administration as the reciprocal tariffs are based on a proprietary formula that includes tariffs, other monetary barriers such as Value Added Taxes (VAT), and a subjective measure for “cheating,” such as currency manipulation. The point being, it appears that as tariffs on U.S. goods are lowered, so too would U.S. reciprocal tariffs from the U.S. While it wasn’t expressly said that these reciprocal tariffs can lead to tariff reduction, it was strongly implied (and that is a mild silver lining).

From a market standpoint, the big issues now are 1) How long are these tariffs in place and 2) Are there any meaningful exemptions to these substantial tariff increases? If the answers to those questions are “a long time” and “no,” then fears of a dramatic economic slowdown will surge and that will continue to pressure stocks.

From a positioning standpoint, the tariff announcements are worse than feared but they are not, as of yet, a definitive bearish game changer. Our team says that simply because we again do not know how long they will last or whether there will be enough exemptions to remove some of the sting. That said, clearly this is an incremental negative for markets and we do not expect the recent lows to hold in the S&P 500.

Bottom line: While the tariff announcement was not a worst-case scenario (that would have happened if there was no hope of global tariff reduction), it was an incremental negative and we should expect more market volatility in the near term (although we would not take this as a signal to materially de-risk from stocks, at least not yet).

The Bull Case vs. the Bear Case Post Tariffs

Reasonably, there is a lot of confusion and worry from investors about this market, so now that we know the tariff plans, we want to step back and lay out the bullish case for stocks (yes one still exists) and the bearish argument for stocks, so that 1) We are all well versed on these two outcomes and 2) Can confidently and clearly discuss them with clients or prospects.

The Bullish Case

It is not a total washout. The market is not as bad as the index performance implies and it has not been a total market wipeout. For much of yesterday, defensive sectors (XLV/XLU/XLP) were higher on the day and YTD, as each of those sectors is up about 5% YTD. Here is the point: Tech and consumer stocks are getting crushed, but this market remains far from a total wipeout that we see in typical bear markets. The index declines aside, this is still a market that is rotating from tech and consumer names to the rest of the market, and that is encouraging.

The Trump Put Still Exists. This current market calamity is very different from two recent ones (the pandemic and financial crisis), in that, it is manufactured by government policy. President Trump initiated these tariffs with the stroke of a pen and he can reverse them with that same pen or via a post on Truth Social. This is not some existential crisis we cannot solve and if it is a policy error, it can be corrected. To that point, the “Trump Put” still exists, although it may be lurking with the S&P 500 down 20% or 25% YTD (not a great outcome but still, it exists). More to that point, yesterday, two Senators (a Republican and a Democrat) introduced legislation for new tariffs to require Congressional approval. And while that bill will not pass, clearly Congress has taken notice of what is happening. So, while Trump may not be up for re-election, virtually everyone in Congress is, and even Republicans will only tolerate this policy for so long if it fulfills fears and causes a recession.

At Least Now We Know. After three months of speculation, we now know the worst-case tariff scenario. Yes, the president can raise tariffs further if other countries retaliate, but at this point, that is not going to make a difference—We mean, the economic fallout from 56% tariffs on China or 76% tariffs on China will not be that different! The unknown tariff overhang has now been removed and while it has been replaced by worse-than-feared tariffs, the incremental direction for tariffs is now lower, not higher. To that point, as long as it is reasonable to assume these tariffs will be reduced or eliminated in three-to-six months, then this is not a bearish game changer.

Obviously, tariffs are a headwind for stocks and slowdown fears are surging and markets will be under pressure for the near term. But at the same time, the tariff policy is now known, removing a major unknown, and the incremental direction could be towards fewer tariffs, not more. Finally, an economic slowdown is not a guaranteed outcome and, after all, this policy can be reversed with the stroke of a pen. Markets will stay volatile, but the bulls should view this as a long-term opportunity.

The Bearish Case

Welcome to the 1970s. Trump’s tariff declaration will bring back memories of President Nixon’s price controls and go down in history and a colossal policy mistake, but not before it revives stagflation as prices surge and growth slows, putting the nation in an economic vice. First, CPI and other inflation measures will jump on a combination of 1) Consumers front-running tariffs and price increases and 2) Actual price increases. And even if those are one-time disruptions and do not fuel continued inflation (which is dubious at best), the jump in prices will keep the Fed from cutting rates, leaving the economy “on its own.” In sum, it is a repeat of the 1970s, where the Fed could not help support growth and self-inflicted policy mistake after mistake pummels the U.S. economy.

This market is way overvalued. At the start of the year, the consensus earnings estimate for the S&P 500 was about $270/share. That is borderline laughable now. Even if the administration’s goals of a return to U.S. manufacturing are realized, it will take quarters and years for that to occur. In the meantime, corporate earnings will suffer from either 1) Margin compression as they eat tariffs, 2) Revenue reduction as consumers simply do not buy or 3) A combination of the two. Meanwhile, even if we use that $270/year EPS figure, at 5,400 the S&P 500 is still trading at 20X earnings, which is easily 10% too high for a looming stagflationary environment, and we could make a credible case that if these tariffs stay on at current levels, a 15X multiple is more appropriate. That means “fair value” in the S&P 500 could be more than 20% lower from here!

Good news is meaningless in the near term. The administration has basically guaranteed that any good economic data or earnings results (which include the Q1 earnings season that starts next week) will be viewed as meaningless because it all happened before these tariffs. If data is good, it will be ignored for this entire month and, likely, next month as well. Meanwhile, any strong earnings are also now useless as we will have to see how companies perform in the new reality. Bad news, however, is even more meaningful. Investors are scared, so any news that contains even a hint of stagflation will only serve to exacerbate recession concerns and further pressure stocks.

The Trump Put may be in the 4,000s for the S&P 500. Even bears will concede this policy error can be corrected, but it appears that President Trump has a very high pain tolerance with markets and it may take a 20%-25% decline to make the policy error evident. Using history as a guide, the last time the Trump Put was elected was December 2018, when the S&P 500 still fell another 10% past that and it’s not unreasonable to think we could see a 30% decline in stocks if these policies stay in place.

Bottom line: This is a colossal policy mistake and the only question now is, how bad does it get? Unless these policies are reversed soon, the likely answer is… a lot worse.

Our professional thought is that we have found technical support here at around 4850 +/- on the SP500 and are looking for anywhere from a 6-10% of completely oversold conditions. We are beginning to see a washout of supply and believe demand will pick up very quickly and violently.

Market Multiple Levels Chart

Ready to Navigate These Markets Together?

Schedule your portfolio review to discuss how these market dynamics may impact your allocation strategy.

Schedule Your Review

Disclaimer: The Financial Market Insight is protected by federal and international copyright laws. Vann Equity Management is the publisher of the newsletter and owner of all rights therein and retains property rights to the newsletter. The Financial Market Insight may not be forwarded, copied, downloaded, stored in a retrieval system, or otherwise reproduced or used in any form or by any means without express written permission from Vann Equity Management. The information contained in Financial Market Insight is not necessarily complete and its accuracy is not guaranteed. Neither the information contained in Financial Market Insight, nor any opinion expressed in it, constitutes a solicitation for the purchase of any future or security referred to in the Newsletter. The Newsletter is strictly an informational publication and does not provide individual, customized investment or trading advice. READERS SHOULD VERIFY ALL CLAIMS AND COMPLETE THEIR OWN RESEARCH AND CONSULT A REGISTERED FINANCIAL PROFESSIONAL BEFORE INVESTING IN ANY INVESTMENTS MENTIONED IN THE PUBLICATION. INVESTING IN SECURITIES, OPTIONS AND FUTURES IS SPECULATIVE AND CARRIES A HIGH DEGREE OF RISK, AND SUBSCRIBERS MAY LOSE MONEY TRADING AND INVESTING IN SUCH INVESTMENTS.

© 2025 Vann Equity Management. All rights reserved.

February 2024 Market Insight | Vann Equity Management
Vann Equity Management

Financial Market Insight

📅 February 13, 2024 📊 Monthly Market Analysis 🏛️ Institutional Research

Highlights

Key Takeaways

  • What Could Interrupt This Rally?
  • Weekly Market Preview: Can Inflation and Growth Data Push Stocks Even Higher?
  • Weekly Economic Cheat Sheet: CPI Tomorrow, Key Growth Readings Thursday.
  • Special Reports for Advisors and Advanced Renders:
  • Market Multiple Table Update
  • Is NYCB A Canary in the Commercial Real Estate Coal Mine?

Stocks

S&P 500 Chart

The S&P 500 traded above 5,000 last week thanks to strong Treasury auctions reducing concerns about demand for U.S. debt and on generally solid economic data.

✓ What’s Outperforming: Growth factors, tech, consumer discretionary and communication services have outperformed thanks to strong earnings and continued “AI” enthusiasm.

✓ What’s Underperforming: Defensive sectors and value have underperformed recently mostly as Treasury yields have risen, although they are poised to rebound substantially if there is a surprise of growth.

What Could Interrupt This Rally?

Stocks extended the rally and the S&P 500 hit a new all-time high and finally topped the 5,000 level; the question that investors should be asking is not “Why did stocks keep rallying?” but rather “Why would stocks not keep rallying?”

Our investment team says that because the news and data reinforced the three drivers of this bull market:

  1. Fed rate cuts by May
  2. Solid economic growth (and no signs of a hard landing)
  3. Continued disinflation and strong earnings

Our broader point is this: The burden of proof lies squarely with the bears and so far, the economic data and Fed speak have not done enough to disprove any of those four bullish factors.

Now, while it is true that the burden of proof lies with the bears, and so far, they have not had any news to derail this rally, the reality is there are a number of risks emerging. Here is the point: We get the S&P 500 5k euphoria, but the inevitability of the rally is not accurate. Yes, data has pointed to a sweet spot for growth, inflation, and the Fed; but that will not last forever and there will be bad news for this market, there always is.

So, our investment team wanted to point out the risks that have quietly grown in the background during this rally:

  1. Rate cut disappointment: The chances of a May rate cut have declined from 100% three weeks ago to just over 70% as of last Friday. If those expectations drop below 50%, Treasury yields will rise and that will be a negative for stocks.
  2. Layoffs: The jobless numbers (monthly numbers and claims) are at odds with the long and growing list of companies announcing layoffs. More to that point, the key aspect of the Q4 earnings season was cost-cutting by companies (meaning layoffs mostly). For now, that is supporting earnings; however, it is our thinking that it is inevitable that these start to work their way into employment statistics in the next quarter or two. The bottom line, for now, cost cutting is positive but the number of layoffs.
  3. Commercial real estate (CRE): We profiled this risk last month, and what is notable is it is not just New York Community Bancorp (NYCB) that has been hurt by bad commercial real estate loans. KREF (KKR Real Estate Finance Trust) cut its dividend on bad CRE loans, and this week Treasury Secretary Yellen acknowledged risks in the CRE market, especially to non-bank lenders. The point being, this does not have to be a financial crisis to hit stocks and the likelihood of this being a non-event seems low to us.
  4. Valuations, enthusiasm: Our team has always maintained that valuations themselves are not something that causes a reversal in stocks; and that is the case again this time. Something bad will have to happen to disrupt this momentum higher. However, valuations and enthusiasm do make any reversal more painful and intense; and at this point, the S&P 500 is priced for perfection and could easily give back 10% if we see one of the four positive drivers of this market materially contradicted.

Bottom line: it is important to acknowledge that this rally has been driven by actual good news and bullish expectations being reinforced by actual data. At the same time, the risks that kept investors worried in October (and even throughout 2023) have not been vanquished—they simply have not shown up, yet!

From a positioning and tactical standpoint, we continue to prefer the minimum and lower volatility and value overgrowth. These metrics outperformed through January but have lagged the past two weeks into February, as tech has rallied after earnings; but the risk-reward here continues to imply we should be focused on limiting downside exposure in the event of disappointment, not reaching for upside in a market that is already trading at an unsustainable valuation (above 20X earnings) and has priced in essentially a financial version of Nirvana (low inflation, dovish Fed, solid growth, resilient earnings and no negative surprises). We suppose that can happen, but in our 30+ years in this business, we have not seen it yet (and this is not to be confused with irrational exuberance).

Economic Data (What You Need to Know in Plain English)

There were only two notable economic reports so far in February, but both supported the “No Landing” economic thesis and as such, helped the S&P 500 to touch 5,000 on Thursday. However, one of the reports also echoed a potential rebound in inflation and as such, this week’s CPI, which will be closely watched as a rebound in inflation is not at all priced into stocks (or bonds) at these levels and would cause immediate volatility.

Looking at this month's data, the key growth report was the ISM Services PMI. In December, this number got uncomfortably close to 50 and a drop below that level would be a clear, negative economic signal. However, the January ISM Services PMI bounced back and rose to 53.4 vs. (E) 50.5 and the details were strong as New Orders, the leading indicator in the report, rose to 55 from 52.8, implying future strength.

However, the one negative in this report was a jump in the price index to 64.0 from 56.7. That is a multi-month high and, disconcertingly, it matches the jump we saw in prices from the January ISM Manufacturing PMI two weeks ago. Now, those numbers do not mean inflation is rebounding, but they cannot be discounted either, so we will need to watch inflation metrics (including this week’s CPI) because a surprise rebound in inflation would push yields higher, stocks lower and jeopardize a May rate cut and the idea of five-six rate cuts in 2024.

For now, they are just two numbers, and for a rebound in inflation to pressure stocks we will need to see higher-than-expected readings from CPI and the Core PCE Price Index.

The other notable number this month was weekly jobless claims, which declined slightly to 218k vs. (E) 227k. The weekly claims data continues to confirm other labor market readings that the jobs market remains strong. For us to become worried about the economy, we would need to see weekly claims move through 250k towards 300k and there is simply no evidence of that happening now and as such, the economy remains remarkably strong.

Looking at the growth data, all the important reports come on Thursday. The key growth reports this week is retail sales for the simple reason that the U.S. economy is consumer-driven and as long as retail spending is solid, it is very hard to envision a real economic slowdown.

We also get the first look at February economic activity via the Empire and Philly Fed manufacturing indices (both out Thursday morning). These regional indices have been especially volatile lately and not correlated to the more important ISM Manufacturing PMIs, but they still matter and if both show significant weakness that will be an incremental negative, while coordinated strength will be a positive for markets.

Bottom line: This market has rallied on the ideas of 1) Fed rate cuts (meaning May or earlier), 2) Stable growth and 3) Continued falling inflation. The data this week has the opportunity to continue to reinforce those expectations (and support S&P 500 5,000) or refute them (and pressure stocks), so this is an important week for investors.

Commodities, Currencies & Bonds

Gold Weekly Chart

Commodities rallied moderately last week thanks mostly to gains in oil, as a lack of a ceasefire in Gaza increased geopolitical tensions and sent oil sharply higher on the week.

Commodities remain mixed as a stronger dollar, fading hopes for economic growth overseas and easing inflation worries continue to weigh on the metals, while escalating geopolitical tensions resulted in energy bucking, the otherwise heavy trend, with oil posting a solid gain.

Trading in gold has remained quiet as futures remained pretty well pinned to the $2,050 level, oscillating on either side before revisiting the key technical level. The modest rise in the dollar and rebound in Treasury yields were negative fundamental influences on gold; however, and there was some meaningful technical weakness in the price action into the weekend leaving risks of a near-term pullback in gold elevated. Look for initial support at $2,000/oz. as the long-term outlook remains bullish given the new record highs in late 2023.

For now, the outlook for the oil market remains cautiously bullish supported by the fact that the term structure of the futures market reverted to backwardation, indicating a bullish imbalance in supply and demand in the physical market.

Bottom line: the best-case scenario for the Israel-Hamas conflict, a ceasefire, is the worst case for the oil market right now.

Special Reports for Advisors and Advanced Renders

Market Multiple Table Update

The February update of the Market Multiple Table clearly and efficiently delivers this message:

The current drivers of stocks and bonds are positive, but at these levels the market has priced in essentially zero chance of disappointment. If we do get negative news from any of these drivers, a 10% correction is not just warranted, it’s likely.

Looking at the changes in this month’s Market Multiple Table, there were several positive changes. Starting with Fed policy expectations, the biggest point is that the Fed formally acknowledged that rate cuts are coming and as such, that is a positive, as it increases the market multiple (which rose to 18.5X-19.5X). Now, our team did see some slight deterioration there, as Powell did push back against a March rate cut. However, as we have pointed out, March vs. May does not really matter and markets do still expect five or six rate cuts in 2024, so the outlook for the Fed remains dovish.

Turning to growth and inflation, the news for the month was also positive. Economic data is showing some signs that momentum may be plateauing, but at the same time there are no hints of a soft landing. On inflation, metrics have largely continued to decline and most importantly, the past six month’s core inflation readings annualized have been below 2.0% y/y, meaning that the Fed has reason to think inflation has returned to target.

Finally, on earnings, the important takeaway from the Q4 earnings season (which just ended) was that the $240-$245 2024 S&P 500 earnings range remains intact; but we have seen mild deterioration as the consensus is now around $243, down from the previous $245.

A Game of Multiples Table

The market has more than priced in the “Gets Better If” scenario from last month, as the S&P 500 traded above that estimate. The problem, of course, is that while the current drivers of the market are positive, all of them still have the potential to reverse. None of them is a “done deal” and as such, pricing in the “Better If” scenario is aggressive and it is why these levels are not supported by fundamentals (but they are supported by momentum).

Bottom line: The net takeaway is that the outlook for stocks remains positive, but this market also remains “over its skis” from a valuation standpoint. That does not mean the rally cannot continue on momentum, but it is a clear signal that a sudden, sharp pullback in real disappointment should not be a surprise.

Current Situation: The Fed has pushed back on March rate cuts, but May is still likely and markets expect five or six cuts in 2024, economic growth remains solidly positive but not “Too Hot,” inflation continues to trend lower towards the Fed’s 2% target making a rate cut likely sooner than later (May). The current situation reflects the positive drivers that have powered stocks higher since the start of the year, as the Fed has acknowledged rate cuts are coming, economic growth has remained resilient but has not been “Too Hot” while inflation metrics, including the most recent data, are pointing towards a continued decline in inflation. This generally positive set-up has underwritten the gains in stocks YTD.

Market Multiple Levels Chart

Things Get Better If: The Fed confirms a May rate cut, economic data stays Goldilocks and inflation continues to decline towards the Fed’s 2% target. This environment would solidify the positive macro environment for stocks and bonds and extend the reasonable valuation for this market above 4,900. This would essentially reflect a “perfect” environment for stocks of 1) Imminent rate cuts (so a higher market multiple), 2) Strong but not “Too Hot” growth and 3) Falling inflation. While not totally justified by valuations, given momentum, in this environment a run in the S&P 500 towards 5,000 would be reasonable.

Things Get Worse If: The Fed materially pushes back on the idea of rate cuts in May and the expectation for five or six cuts this year, economic growth suddenly rolls over or materially accelerates, and inflation metrics (CPI/Core PCE Price Index) rebound. This scenario would essentially undermine the assumptions behind much of the Q4 and January rally and given how stretched markets are, the net result would be substantial declines in stocks and a giveback of much of the October-to-January rally would not be out of the question. While it seems like this outcome is not possible given the current positive outlook, none of this is set in stone and this is a legitimate scenario we need to be mindful of, because it is possible if data breaks the wrong way.

Is NYCB A Canary in the Commercial Real Estate Coal Mine?

New York Community Bank (NYCB) stock has continued to decline following its disastrous earnings report and because the main reason for NYCB’s unexpected quarterly loss was two poorly performing commercial real estate loans (one on a co-op building and one office building) that has resurrected worries that the commercial real estate market may be a brewing crisis on the horizon.

Those concerns are not unfounded and commercial real estate is a legitimate risk to this market and the economy, but it has to be viewed in the appropriate context. So, we wanted to cover:

  1. Why commercial real estate worries are legitimate,
  2. If it can be compared to what occurred in ’07/’08 and,
  3. What any type of commercial real estate stress means for markets.

Why Are People Worried About Commercial Real Estate? The commercial real estate (CRE) market is facing stress and prices are declining thanks to the dramatic Fed rate hikes of the past two years and the lingering impact of the pandemic. Commercial real estate loans are very different from residential mortgages, but two particular differences make CRE especially susceptible to quickly rising rates. First, most CRE loans are “interest only” meaning there is no principal reduction. Second, they are mostly variable rates, meaning the interest rate resets every several years. That means CRE is especially sensitive to a sharp and intense increase in rates (like we have seen over the past two years) because the amount of principal outstanding never declines and because a big increase in interest expense can make CRE projects unprofitable, which can result in fire sales that further depress property values.

This is what has started to happen in recent months as the CRE market is performing poorly. Based on Fed data, the delinquency rates on CRE loans have risen to 1.07%, which is only slightly below the 1.13% Q4 2020 high (at the peak of the pandemic shutdowns). That 2020 reading was the highest level since 2015, so if we see the default rate rise above 1.13%, that will be a nine-year high and a clear sign of deterioration.

Looking forward, it is reasonable to expect delinquency rates to rise as the IMF estimates there is $1.2 trillion in CRE debt that is maturing (and will have to be renegotiated at potentially higher yields) in the next two years. The whole CRE market is valued at slightly over $5 trillion, so we are talking about 20% of the market, not an insignificant amount.

Finally, the deterioration in the CRE market is impacting prices. According to the IMF, an aggregate measure of CRE prices has dropped more sharply than during any other Fed tightening cycle over the past 50 years. Aggregate prices of CRE have declined more than 12% over the past two years, much more than during any other tightening cycle. The office portion of the CRE market is especially weak thanks to the slow return of the American worker to the office and the permanent changes to demand for office space as more workers go hybrid. Default rates for office related CRE projects (which make up more than 13% of the CRE market according to Vanguard) have risen above 5% and are pricing in stress.

Bottom line: a combination of higher rates and workplace changes have negatively impacted the CRE market and default rates are rising, and prices are declining. However, for this to be material, negative influence on broad markets, we must see evidence of contagion, as that is the key to determining when one sector’s stress becomes a major problem for markets.

Can What is Happening in CRE Be Compared to the Origins of the Housing Crisis? So far, thankfully the answer is “No,” but the list of similarities is growing. One of the key factors that made the subprime implosion so damaging to the economy and markets was the failure of regulators and investors to understand the reach and depth of leverage in the deals. In 2007, it would have been laughable to think a collapse in subprime housing would have bankrupted AIG (an insurance company) and General Motors (via the GM Financing unit). Yet, that is what happened.

So, it was disconcerting to learn about rising stress in the mezzanine funding portion of the real estate market, which is linked to CRE. Mezzanine financing is utilized by investors who are looking to buy a property and either 1) Can not obtain enough equity for a conventional purchase or 2) As a way for investors to increase total leverage and boost returns (and risk). Essentially, think of mezzanine financing as covering the gap between equity and a conventional mortgage, but with a higher interest rate and higher risk.

In many ways, it is reasonable to expect any real, significant stress in the CRE market to appear in these mezzanine deals, and according to the WSJ, that is what is starting to happen. The WSJ compiled a list of what it believes to be mezzanine-related foreclosures filed through October 2023 and the number was a record high. The WSJ estimates there were 62 mezzanine-related foreclosures (which are very hard to track because they are not conventional mortgages) in 2023, nearly double the amount in 2022; and given the difficulty in identifying these foreclosures, it is reasonable to assume there are many more in the pipeline.

This is concerning for two main reasons. First, it implies the stress in the CRE market is getting progressively worse. Second, it reveals the liability from CRE debt may run deeper and stretch wider than it is currently believed. We say that because while regulated banks are much better capitalized compared to before the GFC and the Fed and other institutions can quantify those banks’ CRE risk, it is much harder to do so with the mezzanine deals because many of the loans are made by private investment groups such as PE firms and asset management companies. If these mezzanine deals go south, it has the potential to create contagion across previously thought to be unrelated assets. Thankfully, at this point, it would be an exaggeration to link what could happen with the CRE market to the housing crisis.

First, the size of the markets is vastly different. The residential real estate market is valued at over $50 trillion. The CRE market is valued at around $5 trillion. The point being, that the potential problem is much smaller than what we were facing in the residential real estate market in 2007. Additionally, the key from a systemic standpoint remains the large banks and they should be mostly insulated from any substantial CRE risks due to 1) More stringent capital requirements and 2) The fact that they are too big to fail, and in the end, we know how this goes if it gets bad enough (with the Fed extending funding).

But just because this is not lining up to be a repeat of ’07/’08 does not mean it could not impact markets directly and intensely. Headwinds in commercial real estate (CRE) have the potential to impact markets from both a macro and micro-economic standpoint as stress in the CRE market would pressure most assets broadly and specific sectors directly.

Macro Impact: All about contagion. From a macro/broad-market standpoint, the concern here (as it is with all industries facing stress) is contagion, so the focus first is to monitor for any signs of contagion and that brings us to the banks, specifically regional and community banks.

Losers: Banks. Community and regional banks provide the majority of CRE funding and if what we saw with NYCB is an initial sign of CRE-related bank stress, we should start to see it materialize more fully in the community and regional bank ETFs and stocks. QABA is the First Trust NASDAQ ABA Community Bank Index Fund. It has $90 million in AUM and is mostly traded by appointment, but it contains some of the more liquid publicly traded community banks such as Commerce Bancshares (CBSH), Wintrust Financial (WTFC), Bank OZK (OZK), and United Bankshares (UBSI). The community bank stocks in the index are liquid enough that if we see CRE increasing bank contagion risks, it should show up in these names. Bottom line, QABA is a decent indicator for CRE-related banks stress and if it begins to drop sharply, that is a negative signal (it is already down 10% YTD but if that keeps going, it is a clear negative). Regional banks (of which NYCB is considered one, although it is on the larger end of the spectrum) are also a useful indicator for increased contagion signs and like QABA, KRE is down 10% YTD with the majority of the declines coming after the NYCB earnings announcement.

Winners: Treasuries. If we see contagion risks begin to spread regarding CRE risks, we will see a standard risk-off move across assets that will include a flight to Treasuries. Additionally, markets have revealed that they expect any CRE-related stress to result in more aggressive Fed rate cuts, which is why the 10-year yield fell 30 basis points following the NYCB earnings release. If the market believes contagion is spreading, then TLT, the iShares 20+ Year Treasury Bond ETF, should be one of the biggest beneficiaries as investors move to 1) Capture risk-free yields as rates fall and 2) Position for a more likely economic slowdown.

Bottom line: Contagion is the major, macro risk to markets and if we see CRE-related contagion concerns start to grow and spread, that will hit the bank stocks and specifically the community banks (QABA) and the regional banks (KRE) and that is what we will watch going forward to monitor contagion concern. But that contagion will almost certainly result in sharply falling yields and a risk-off move across assets that will benefit Treasuries (but not corporate bonds) and TLT is a likely place to hide and outperform.

Micro Impact: REITs. The majority of publicly traded REITs are focused and exposed to commercial real estate via office and retail properties (malls) and multi-family housing. As such, they are acutely susceptible to a declining CRE market.

Most Vulnerable: Office & multi-family housing focused REITs. We have seen that play out as XLRE, the Real Estate Sector SPDR, has declined 4% YTD. But commercial real estate is a diversified space and for some contrarians out there, the declines in REITs on CRE worries may present some interesting longer-term opportunities, especially if one thinks the Fed will dramatically cut rates.

Within the CRE space, office related CRE projects are considered the most vulnerable to declines. That was the belief before the NYCB earnings debacle and that is even more so, now.

Similarly, there are also concerns about the multi-family CRE segment, which is defined as buildings and projects with more than four residences and this one is of particular importance because while the office segment is just about 13% of the 5% Trillion CRE market, the multi-family segment is about 40% of the CRE market or about $2 trillion dollars. From a macro sense, if we see weakness in the multi-family segment starting to spread (remember one of NYCB’s delinquent loans was on a co-op building), that is a clear broader negative. But from a tactical standpoint, it also makes us want to avoid residential REITs until there is more clarity.

Ready to Navigate These Markets Together?

Schedule your portfolio review to discuss how these market dynamics may impact your allocation strategy.

Schedule Your Review

Disclaimer: The Financial Market Insight is protected by federal and international copyright laws. Vann Equity Management is the publisher of the newsletter and owner of all rights therein and retains property rights to the newsletter. The Financial Market Insight may not be forwarded, copied, downloaded, stored in a retrieval system, or otherwise reproduced or used in any form or by any means without express written permission from Vann Equity Management. The information contained in Financial Market Insight is not necessarily complete and its accuracy is not guaranteed. Neither the information contained in Financial Market Insight, nor any opinion expressed in it, constitutes a solicitation for the purchase of any future or security referred to in the Newsletter. The Newsletter is strictly an informational publication and does not provide individual, customized investment or trading advice. READERS SHOULD VERIFY ALL CLAIMS AND COMPLETE THEIR OWN RESEARCH AND CONSULT A REGISTERED FINANCIAL PROFESSIONAL BEFORE INVESTING IN ANY INVESTMENTS MENTIONED IN THE PUBLICATION. INVESTING IN SECURITIES, OPTIONS AND FUTURES IS SPECULATIVE AND CARRIES A HIGH DEGREE OF RISK, AND SUBSCRIBERS MAY LOSE MONEY TRADING AND INVESTING IN SUCH INVESTMENTS.

© 2024 Vann Equity Management. All rights reserved.

March 2024 Market Insight | Vann Equity Management
Vann Equity Management

Financial Market Insight

📅 March 25, 2024 📊 Monthly Market Analysis 🏛️ Institutional Research

Highlights

Key Takeaways

  • Market Preview: Updated Risk/Reward Outlook
  • Economic Update: What you need to know in plain English
  • Special Reports:
  • What Is the Bitcoin ‘Halving?’
  • What the Fed Decision Means for Markets: Still All About Growth

Stocks

S&P 500 Chart

The S&P 500 accelerated to new all-time highs thanks to the Fed upgrading its outlook for economic growth this year (and inflation expectations) while critically keeping three rate cuts penciled in for 2024, which reignited soft/no landing hopes in the back half of the week.

✓ What’s Outperforming: Growth factors, including tech and communication services have outperformed thanks to strong earnings and continued “AI” enthusiasm while energy and financials have both had solid runs into the end of the quarter.

✓ What’s Underperforming: Defensive sectors, including real estate and utilities as well as value styles have underperformed recently as Treasury yields have risen, although they are poised to rebound substantially if growth slows down.

This month the stock market rallied to new record highs as the Fed (FOMC) maintained its expectation for three rate cuts this year while simultaneously upgrading its outlook for domestic economic growth. The uptick in inflation expectations was largely dismissed because, as long as, growth holds up, “slightly sticky” high inflation will be tolerated.

However, growth is the key variable as an economic slowdown is not at all priced into the market with the S&P 500 trading above 5,200 at a never-before-sustained next, 12-month multiple of 21.5X expected current-year earnings.

To be sure, history has proven on multiple occasions that markets can remain irrational longer than even the most seasoned investors can remain solvent, which is why it would be a fool’s errand to try to short this market based on fundamental caution right now. There is simply too much bullish momentum behind the advance. To that point, the bullish fundamental mantra for 2024 is still intact based on the expectations for:

  1. imminent rate cuts this year,
  2. continued disinflation,
  3. resilient growth, and
  4. ongoing AI optimism.

All that is great, and we are hopeful this rally can continue to new highs.

Playing devil's advocate, using the round number of 10% to perform a quick risk-reward assessment of the market, the S&P 500 is up nearly 10% YTD; and another 10% gain from here would take the S&P 500 to just shy of 5,800. This would mean an extremely stretched multiple of 23.8X this year’s expected earnings. Conversely, a 10% pullback from here would take the S&P 500 down towards 4,735, which would mean a much more reasonable multiple of 19.5X this year’s earnings and match the “Current Situation” midpoint price target from the March Market Multiple updates.

So, if everything remains perfectly “Goldilocks” between economic growth, inflation, earnings, and Fed policy, there is a case to be made for that next 10% to the upside. However, the number of risks to the overextended rally leaves our investment team a bit skeptical about meaningful further upside and cautious (not bearish) about the YTD gains as one negative catalyst (i.e. a hot inflation print or weak growth report) could spark volatility and a pullback in stocks, which would likely be amplified by the combination of an increased amount of leverage in the long mega-cap tech trade, and a historically overcrowded short-volatility position.

Economic Data (What You Need to Know in Plain English)

This month the market’s focus was on the March Fed meeting, which proved to be a bullish catalyst for markets. Economic data was mixed, as several reports met the perfect “Goldilocks” criteria needed for a soft landing, while others were a bit less encouraging.

Chairman Powell and the company did not disappoint with their Summary of Economic Projections which revealed an upgraded outlook for growth and still mentioned three rate cuts anticipated for this year, which overshadowed a modest increase in their inflation expectations for 2024. Powell confidently proceeded through the Q&A session and there were no surprises, statements or comments that discounted the dovish-leaning outcome of the FOMC meeting. That saw stocks sprint to record highs amid firming confidence in the prospects of a soft landing in 2024.

No material moves in the weekly jobless claims data and a strong Philadelphia Fed Business Outlook Survey provided very optimistic forward-looking indicators and evidence of easing price pressures, as well as, improving corporate margins. Those reports followed modestly soft Composite PMI Flash releases in Europe, which were received as slightly dovish.

Bottom line: There were a few less-favorable reports sprinkled into the economic data this month, but for the most part, the widely followed economic releases supported the idea that the Fed is on track to cut rates multiple times between now and the end of the year with an initial cut still being priced in for some time in the summer. Any data that challenges that thesis, such as hot inflation or very strong growth will present a risk to the 2024 rally.

Commodities, Currencies & Bonds

Gold and 10-Year Yield Charts

Commodities traded with a bias to the downside last week with copper the notable laggard with a 3% pullback after previously breaking out to YTD highs. Gold edged higher on dovish money flows while oil retreated from a test of $83/barrel, but the space remains in a long-term uptrend.

Commodities were volatile: Copper extended its 2024 rally early in the week during solid Chinese economic data as Retail Sales and Industrial Output figures both topped estimates. On the charts, the outlook for copper is still bullish after the breakout through resistance earlier in March, and last week’s 3%+ pullback should be viewed as a countertrend pullback in an up-trending market.

Gold has been trading in a broad range of more than $75/oz. as futures closed at a new high in the wake of the dovish Fed. The reason for the new high close was a spike in market-based inflation expectations to the highest in more than four months, and that sent futures to new highs before the less-favorable economic data (Composite PMI Flash and Existing Home Sales) sent the dollar to six-week highs, which poured cold water on the gold rally.

WTI crude oil advanced into technical resistance above $83/barrel ahead of the EIA report and Fed. The EIA data was mostly bullish but not enough to prevent a profit-taking pullback that carried the price down towards $80/barrel.

Bottom line: oil remains in a 2024 uptrend with a solid support band lying between $78 and $79/barrel while the YTD high of $83/barrel is the level to beat for the bulls.

The Dollar Index rallied solidly as the Fed was dovish, but not as dovish as other global central banks. That dynamic paired with still-stronger economic data in the U.S. vs. other major developed countries supported a weekly gain in the greenback.

Dollar strength was the theme in currency markets as the greenback initially pulled back from a test of the March highs after the Fed was initially received as dovish.

The outlook for the dollar remains universally bullish as we approach the end of the first quarter with the U.S. economy holding up as the most resilient, while cracks in growth overseas and faster-than-expected disinflation trends in other major developed economies are weighing on most of the G7 currencies.

The Treasury market reaction to the Fed decision and last week’s economic data was largely dovish and that is an encouraging sign for stocks near term, as it is not just equity investors but also bond traders buying into the idea that the Fed will be able to achieve a soft landing with multiple rate cuts in the second half of the year.

Special Reports for Advanced Renders

What Is the Bitcoin ‘Halving?’

Our investment committee does not focus a lot on Bitcoin for numerous reasons, primarily because it has been largely an un-investable asset class for most clients (either practically or from a risk management standpoint). However, the approval of the Bitcoin ETFs has changed that, and as such, we will be modestly increasing our Bitcoin analysis in our Vann Equity Market Insight, as it is simply a very popular topic among investors. To be clear, please do not take this as an endorsement or opinion on Bitcoin, it is just our team reacting to the changing investing landscape and wanting to make sure our clients have the analysis. Appropriately, a popular Bitcoin-related topic: “The halving.”

Bitcoin’s “anonymous” creator, Satoshi Nakamoto, wanted Bitcoin to stand out from all paper currencies (i.e., dollar, euro, franc, etc.). Nakamoto wanted Bitcoin to hold its (or gain in) value over time, so he built an “anti-inflationary mechanism” into its code.

Per its code, the “block subsidy is cut in half every 210,000 blocks, which will occur every four years.” Therefore, every four years, there is a 50% reduction in the number of new Bitcoins that come to market. This continuous four-year cycle – built into Bitcoin’s code – is fixed and cannot be altered. This is what is known as “the halving” (also called “the halvening”).

The 2024 halving will reduce the number of new Bitcoins mined (the “block reward”) from 6.25 to 3.125 per block – or from 900 Bitcoins produced each day to 450 Bitcoins produced daily. Eventually, the number of Bitcoins will hit its maximum supply of 21 million coins – expected to be by the year 2140. There are roughly 19.6 million Bitcoins in existence today.

Now, Bitcoin has gone through three of these cycles so far. The first was in November 2012. The second was in July 2016. The third was in May 2020. And every time, Bitcoin’s price has rallied substantially.

Bitcoin Halving Chart

As one can see in the chart above, the value of Bitcoin lifts off in a four-year predictable schedule. Each gain was realized within approximately 12-18 months from the halving trigger date.

Although nowhere near the gains after the halving occurs, there is also typically a considerable bump in price leading up to the halving. (Like we have seen this year, with Bitcoin breaking $73,000.)

Why does this predictable event result in these outsized gains? It is pretty much Economics 101: As supply decreases and demand remains constant (or increases), the only thing left to move is price.

The next halving is projected to take place around April 19-20, 2024. So, if the past is prologue, some of these gains have been driven by halving anticipation, but more is still to come.

Again, our investment team is not making a “call” on Bitcoin, but we do want you to know 1) What the halving is and 2) The historical impact of it on Bitcoin prices; because while history does not repeat itself, it often rhymes. At a minimum, our team wants our clients to be able to turn any questions on this topic into opportunities to impress their friends.

What the Fed Decision Means for Markets: Still All About Growth

The Fed decision was essentially “not as hawkish as feared” given the recent firm price data, and the practical impact of last week’s decision was to 1) Keep markets expecting a June rate hike and 2) Keep the “impending Fed rate cuts” part of the bullish mantra powering stocks higher intact. So, a not-as-hawkish-as-feared result combined with a still-intact bullish narrative pushed stocks to fresh highs in the wake of the Fed decision.

Market Multiple Levels Chart

But if there was a “beneath the surface” take away from the Fed, it is that the major focus for investors right now needs to be on growth and specifically whether growth can hold up. There were some small hints that Powell and the Fed may be a bit more worried about growth than the market currently expects, but the bottom line is that the market is not getting more than three rate cuts in 2024 unless growth rolls over and at that point, it is too late anyway. That matters because it implies that rates are indeed going to be mostly higher for longer and higher rates will continue to act as a headwind on growth.

Put differently, the relief from high rates that investors keyed on during the Q4 rally is not coming. Yes, there will be two to three cuts barring a growth rollover, but we are still going to exit 2024 with fed funds over 4.5%.

Markets have tolerated that disappointment well so far in 2024 for two reasons. First, AI enthusiasm continues to rage and that is helping keep the bull market alive and well. Second (and this is more fundamentally important), it is because growth has held up. The market does not care if we get fewer rate hikes as long as growth is not showing any signs of cracking. But if those signs of cracking do start to appear, then the fact that there will only have been one rate cut by July will matter, a lot, because policy will be viewed as restrictive and the outlook for markets will change, potentially violently.

Bottom line: With Fed policy known and major relief on rates not coming in 2024, we must focus on growth and make sure we see, as early as possible, any evidence of a rollover because if that happens, it is a major problem for this market. And that is exactly what we will be doing for our clients.

For now, the bullish mantra of solid growth, falling inflation, impending Fed rate cuts and AI enthusiasm is alive and well and the S&P 500 has hit new highs. Until multiple points in the mantra are invalidated, the path of least resistance in this market remains higher and pullbacks should be viewed as entry points. While AI headlines have been strong, we expect the rally to continue to broaden.

Ready to Navigate These Markets Together?

Schedule your portfolio review to discuss how these market dynamics may impact your allocation strategy.

Schedule Your Review

Disclaimer: The Financial Market Insight is protected by federal and international copyright laws. Vann Equity Management is the publisher of the newsletter and owner of all rights therein and retains property rights to the newsletter. The Financial Market Insight may not be forwarded, copied, downloaded, stored in a retrieval system, or otherwise reproduced or used in any form or by any means without express written permission from Vann Equity Management. The information contained in Financial Market Insight is not necessarily complete and its accuracy is not guaranteed. Neither the information contained in Financial Market Insight, nor any opinion expressed in it, constitutes a solicitation for the purchase of any future or security referred to in the Newsletter. The Newsletter is strictly an informational publication and does not provide individual, customized investment or trading advice. READERS SHOULD VERIFY ALL CLAIMS AND COMPLETE THEIR OWN RESEARCH AND CONSULT A REGISTERED FINANCIAL PROFESSIONAL BEFORE INVESTING IN ANY INVESTMENTS MENTIONED IN THE PUBLICATION. INVESTING IN SECURITIES, OPTIONS AND FUTURES IS SPECULATIVE AND CARRIES A HIGH DEGREE OF RISK, AND SUBSCRIBERS MAY LOSE MONEY TRADING AND INVESTING IN SUCH INVESTMENTS.

© 2024 Vann Equity Management. All rights reserved.

January 2024 Market Insight | Vann Equity Management
Vann Equity Management

Financial Market Insight

📅 January 3, 2024 📊 Monthly Market Analysis 🏛️ Institutional Research

Highlights

Key Takeaways

  • Weekly Market Preview: Five Market Assumptions to Know as we Start 2024
  • Weekly Economic Cheat Sheet: Jobs Report in Focus
  • Special Reports and Editorial:
  • Two Important Differences in 2024
  • Thoughts On 2024

Stocks

S&P 500 Chart

Stocks were little changed last week in very quiet trade as investors wanted a quiet end to a very strong 2023 as the S&P 500 rose more than 24% on the year.

✓ What’s Outperforming: Growth factors, tech, consumer discretionary and communication services, the worst performers in 2022, have outperformed YTD. However, higher yields remain a headwind and as such we do not think this outperformance will last over the longer term.

✓ What’s Underperforming: Defensive sectors and value have underperformed YTD but are still massively outperforming since the bear market started in 2022, and since our primary concern in 2023 was economic growth, we think underperformance will be temporary.

Five Market Assumptions to Know as We Start 2024

The S&P 500 is starting 2024 trading at a very lofty 19.5X valuation and while we are not going to say that valuation is unjustified, we will say that valuation makes several key, positive assumptions about critical market influences in the coming year. How reality matches up with those assumptions will determine whether stocks extend the rally (and the S&P 500 hits new highs and makes a run at 5,000) or give back much of the Q4 Santa Claus rally.

As such, we want to start 2024 clearly defining the five most important assumptions investors are making right now because it is how these events occur vs. these assumptions, and not absolute values, that will determine if stocks and other assets rise or fall in Q1 and 2024.

Assumption 1: Fed cuts rate six times for 150 basis points of easing and a year-end fed funds rate below 4.0%.
The main factor behind the S&P 500’s big Q4 rally was the assumption that the Fed was done with rate hikes and would be cutting rates early and aggressively in 2024. How do we know this is a market assumption? Fed fund futures. According to Fed fund futures, there is a 70%-ish probability the Fed fund rates end 2024 between 3.50% - 4.00%.

Assumption 2: No Economic Slowdown.
Markets have not just priced in a soft landing, they have priced in effectively no economic slowdown as investors expect growth to remain resilient and inflation to decline, the oft-mentioned “Immaculate Disinflation,” a concept that is possible, but to our investment team’s knowledge has never actually happened. How do we know this is a market assumption? The market multiple. The S&P 500 is trading at 19.5X the $245 expected S&P 500 earnings expectation. A 19.5X multiple is one that assumes zero economic slowdowns (if markets were expecting a mild slowdown, a 17X-18X multiple would be more appropriate).

Assumption 3: Solid Earnings Growth.
Markets are expecting above-average earnings growth for the S&P 500 to help power further gains in stocks. How do we know this is a market assumption? The consensus expectations for 2024 S&P 500 earnings per share are mostly between $245-$250. That is nearly 10% higher than the currently expected $225 per share earnings for last year (2023), which points to very strong annual corporate earnings growth.

Assumption 4: No Additional Geopolitical Turmoil.
Despite the ongoing Russia/Ukraine war, Israel/Hamas conflict and escalating tensions between the U.S. and Iranian-backed militias throughout the Middle East, the market’s assuming no material increase in geopolitical turmoil. How do we know this is a market assumption? Oil prices. If markets were nervous about geopolitics, Brent Crude prices would be solidly higher than the current $77/bbl. Oil prices in the high $80s to low $90s reflect elevated geopolitical concern while prices above $100/bbl reflect real worry.

Assumption 5: No Domestic Political Chaos.
This is an election year in the U.S. The Republican front runner, Donald Trump, is facing a long list of various civil and criminal charges along with challenges to whether his name will be on the ballot in certain states. Meanwhile, there has been no long-term compromise on funding the government, so shutdown scares remain a real possibility; and that is before we get into the heart of election season later this year. How do we know this is a market assumption? Treasury yields. A 3.80%-ish yield on the 10-year Treasury does not reflect much domestic political angst. If markets become nervous about the U.S. political situation and/or fiscal situation in the U.S., the 10-year yield would be sharply higher than it is now (well above 4%, like we saw in the late summer/early fall).

Bottom line: These market assumptions are not necessarily wrong. Events could unfold the way the market currently expects. However, these assumptions are aggressively optimistic, and it is how events unfold versus these expectations and not on an absolute scale that will determine how stocks and bonds trade to start the year.

Economic Data (What You Need to Know in Plain English)

The year starts off with a proverbial “bang” from an economic standpoint as we get the three most important economic reports of each month over the next four days. Now that the Fed has dovishly pivoted, “bad” data will not remain “good” for stocks very long, so expect the markets to begin to react negatively to soft reports here. The reason is clear: Now that the Fed has pivoted, bad economic data just means an increased chance of an economic slowdown, something that is not priced into markets with the S&P 500 trading at a 19X multiple.

The key report this week is Friday’s jobs report, which should be a solid, yet unspectacular, number of job adds with a slight drift higher in the unemployment report. Put simply, markets continue to need Goldilocks jobs data to support stock prices, but the margin for error of the report is much smaller now that the Fed has dovishly pivoted.

The next most important economic reports this week come on Wednesday and Friday via the ISM Manufacturing and Services PMIs. The ISM Manufacturing PMI remains below 50 and is expected to stay there while the ISM Services PMI remains slightly above 50. The reason these two reports are important is that if both reports drop below 50 for a few months, that would be a very accurate historical indicator of a looming economic slowdown. The point is that markets will want to see improvement in the ISM Manufacturing PMI and stability (so staying comfortably above 50) in the Services PMI.

The final important economic reports of the week are labor market-related via today’s JOLTS (Job Openings and Labor Turnover Survey) and Thursday’s weekly jobless claims. As mentioned, the labor market broadly remains strong but not too hot and markets will want to see data that reinforces strong employment, but not so strong it increases wages and a bounce in inflation.

Bottom line: Now that the Fed has dovishly pivoted, investors will want to see stability in the economic data above all else in Q1, because if economic data starts to roll over from here, more expected Fed rate cuts will not help (they will be too late) and with the S&P 500 trading above 19X next year’s earnings, there simply is zero economic slowdowns priced into stocks (although Treasuries would rally in the face of soft economic data).

Commodities, Currencies & Bonds

Gold Chart

Commodities decline slightly following a reduction in geopolitical tension and despite a continued decline in U.S. dollar.

Commodities declined broadly in the last week of 2023, thanks mostly to declines in oil as geopolitical tensions eased slightly.

Gold changed little during the week as there was little data or Fed speak to trade-off. Midweek dollar declines helped boost gold, but the impact was modest, although gold remains within striking distance of the new all-time highs hit in early December. Looking forward, we can expect gold to continue to trade inversely off the U.S. dollar and as long the dollar remains broadly under pressure the outlook for gold will remain positive.

OIL MARKET UPDATE

Looking forward, geopolitics will remain an important influence on oil but, barring a major escalation in the Russia/Ukraine war or Israel/Hamas conflict, the larger supply/demand picture will drive oil prices, and as we start the year there remain real concerns 1) If global demand can stay resilient (there are hints the global economic is slowing) and 2) If OPEC+ can remain disciplined on supply (their actions late last year underwhelmed traders) and as such the outlook for oil prices remains mixed over the longer term.

Special Reports and Editorial

Two Important Differences in 2024

Each year in markets is different (it is one of the reasons this is such an interesting business) and there are usually many changes from one year to another. However, there are two important changes that will occur in 2024 that we want to point out because these changes mean that events that were tailwinds for stocks in 2023 (falling yields and earnings results) will become neutral to potentially negative in 2024.

Change 1: Falling Yields Will not be Positive for Stocks
There were two overarching reasons for the rally in 2023: The first was AI enthusiasm powering the “Magnificent Seven” stocks higher and pulling the S&P 500 with it. The second was the expectation of a dovish Fed pivot that essentially saved the 2023 rally in late October.

Falling interest rates were a clear positive in 2023 because they 1) Eased valuation headwinds and 2) Signaled that Fed hikes were ending, which reduced recession changes. However, as we start 2024, the dovish Fed pivot is fully priced into stocks with the S&P 500 just under 4,800 and the market has priced in six Fed rate cuts and year-end 2024 fed funds below 4.00%.

So, the dovish pivot and expected easing policy is already priced into stocks and Treasuries. If we see the 10-year Treasury yield continue to fall to the low 3% or sub 3% range, that is not going to be a major tailwind for stocks because that will not be forecasting a dovish Fed, it will be forecasting slowing growth. Those falling yields will then become a harbinger of a potential economic slowdown and not the welcomed signal of a Fed that is finally turning dovish.

Change 2: Earnings Results Will not Have Low Expectations to Excuse Poor Performance
S&P 500 earnings were not particularly great in 2023 but they were much better than some of the awful expectations that were prevalent when the year started.

To put some numbers on it, many analysts penciled in 2023 S&P 500 earnings between $220 and $225, but there was a definite minority that had estimates much lower, anywhere from $185 to $215, as these analysts expected the recession that never appeared.

Now, as we start 2024, it is the total opposite. Consensus S&P 500 earnings growth is nearly 10% year over year, well above the longer-term averages of around 5%-ish annual growth. Keep in mind, at 4,800 the S&P 500 is trading over 19.5X that $245 earnings estimate, which means there is little room for disappointment from a valuation perspective.

So, “ok” earnings will not be good enough and we got a preview of that in the Q3 numbers (which were not great) and especially in December as results were generally poor. That does not mean the upcoming Q4 earnings season (which begins in mid-January) will not be positive, but for it to be positive it will have to be because of actual good results, not “better-than-feared” results that were good enough in 2023.

Bottom line: The markets will need something “new” to power stocks higher in 2024 because the dovish pivot (which powered stocks higher since October) is fully accounted for while low expectations for earnings and economic growth no longer exist. That does not mean we will not get new, positive influences on stocks, but it will have to come from something new in 2024 because the “low-hanging fruit” of dovish pivot and not-as-bad-as-feared earnings have already been picked to fuel the Santa rally.

Thoughts On 2024

As we look towards 2024, we cannot help but feel as though we are all in a proverbial canoe; and the investing public is violently running to one side of the canoe and then the other, causing it to nearly tip each time. Here is what we mean.

Think back to December 2021. The S&P 500 had just hit an all-time high. The impact of the pandemic was still being felt but tech companies were surging and leading the market higher. The investing public was convinced we were in a new “hybrid” world that was here to stay, fueled by stimulus and forced savings, growth was strong, inflation was rising, and markets admitted that the Fed needed to hike rates in 2022 but did not think it would be that bad. Put simply, market sentiment was resoundingly bullish and while investors admitted there were some issues, they were minimized and the outlook was very, very positive.

Of course, that optimism was unfounded. The Fed was much more aggressive on rate hikes, inflation exploded, growth slowed, and the S&P 500 dropped 19.4%. Put simply, consensus was universally bullish, and consensus was wrong.

Now think back to December 2022. Investors were despondent. The S&P 500 was ending the worst year in over a decade, the Fed was massively hiking interest rates, inflation was not breaking, recession fears were surging, and investors were convinced we were facing either 1) Stagflation or 2) An imminent recession.

Of course, that pessimism was unfounded as growth remained resilient, inflation was broken and the Fed dovishly pivoted. Put simply, the consensus was universally bearish, and the consensus was wrong.

Now, in December 2023, the consensus was absolutely bullish. The soft landing was all but assured. The Fed will cut six times in 2024 but not because of slowing growth and instead because inflation is about to go into some sort of freefall. Despite numerous geopolitical hot spots, none of them will get materially worse, U.S. politics will not be a problem and despite a potentially slowing economy and margin compression, companies in the S&P 500 will grow earnings by nearly 10% this year. The 5,000 mark on the S&P 500 is not a matter of “if,” it is a matter of “when.”

That all may come true and that might be exactly how it works out, but we have been in this industry long enough to know that when everyone seems to be on one side of the proverbial canoe, it is time to get nervous and move to the middle.

In December 2021, we cautioned against this universally bullish outlook as too complacent. Last year, we cautioned against the very bearish outlook saying under the surface, positives were in place.

Those were not predictions. Rather, they were observations stemming from 20+ years of “new year’s” in the markets. The reality of a market in any given year hardly ever matches the consensus and it almost never matches the consensus when it is this sure of the outcome.

We hope the consensus is right. We hope that in the year we are writing to you and the S&P 500 is above 5,000 and that it has been a great year for your businesses. But this universally bullish expectation makes us think everyone is on one side of the canoe when in reality, we need to be in the middle because things can go wrong.

We can still have a growth slowdown and a recession. It is not impossible. Earnings growth can falter as demand slows and margins compress. Geopolitics can provide real, negative surprises. Inflation can bounce back. Domestic politics can present a surprise (it is an election year). None of these events would be shocks, although thankfully, they are not the most likely case.

Bottom line: We view part of our job as making sure you have someone giving you agenda-free analysis that pulls you back to the middle of the proverbial canoe, and as we start 2024 that is what you can expect our Investment team to continue to do.

Ready to Navigate These Markets Together?

Schedule your portfolio review to discuss how these market dynamics may impact your allocation strategy.

Schedule Your Review

Disclaimer: The Financial Market Insight is protected by federal and international copyright laws. Vann Equity Management is the publisher of the newsletter and owner of all rights therein and retains property rights to the newsletter. The Financial Market Insight may not be forwarded, copied, downloaded, stored in a retrieval system, or otherwise reproduced or used in any form or by any means without express written permission from Vann Equity Management. The information contained in Financial Market Insight is not necessarily complete and its accuracy is not guaranteed. Neither the information contained in Financial Market Insight, nor any opinion expressed in it, constitutes a solicitation for the purchase of any future or security referred to in the Newsletter. The Newsletter is strictly an informational publication and does not provide individual, customized investment or trading advice. READERS SHOULD VERIFY ALL CLAIMS AND COMPLETE THEIR OWN RESEARCH AND CONSULT A REGISTERED FINANCIAL PROFESSIONAL BEFORE INVESTING IN ANY INVESTMENTS MENTIONED IN THE PUBLICATION. INVESTING IN SECURITIES, OPTIONS AND FUTURES IS SPECULATIVE AND CARRIES A HIGH DEGREE OF RISK, AND SUBSCRIBERS MAY LOSE MONEY TRADING AND INVESTING IN SUCH INVESTMENTS.

© 2024 Vann Equity Management. All rights reserved.

Future-Proof Your Wealth: Top Investment Strategies for 2025 | Vann Equity Management

Future-Proof Your Wealth: Top Investment Strategies for 2025

Graph showing investment growth trends for 2025
As we approach 2025, market dynamics are shifting with technological advancements, economic uncertainties, and global changes. While no strategy guarantees success, these five steps can help you consider ways to build a resilient portfolio. Remember, this is educational information only.

1. Assess Your Financial Goals and Risk Tolerance

Begin by evaluating your long-term objectives, such as retirement or education funding. Understanding your risk tolerance—whether conservative, moderate, or aggressive—helps in aligning investments accordingly.

Why It Matters

Clear goals provide a framework for decision-making, ensuring your portfolio matches your timeline and comfort with volatility.

Key Takeaways:

  • Define short-term vs. long-term goals.
  • Evaluate how much risk you can handle.
  • Consider consulting a professional for personalized assessment.

2. Diversify Across Asset Classes and Sectors

Spread investments across stocks, bonds, real estate, and alternatives to potentially reduce risk. In 2025, consider exposure to emerging sectors like renewable energy and AI.

Diversification Insight

“Diversification does not eliminate risk but can help manage it by avoiding over-reliance on any single asset.”

  • Include a mix of domestic and international assets.
  • Explore ETFs for broad market exposure.
  • Monitor correlations between assets.

3. Incorporate Sustainable and Innovative Investments

Look into ESG-focused funds and technology-driven opportunities, as these areas may offer growth potential amid global trends.

Emerging Trends

Sustainable investing aligns with regulatory shifts, while innovation in tech could drive future returns.

What This Means:

  • Research ESG criteria for alignment with values.
  • Consider sectors like clean energy and digital transformation.

4. Implement Risk Management Techniques

Use tools like stop-loss orders or hedging to protect against downturns. Stay informed about economic indicators that could impact markets in 2025.

Risk Considerations

Volatility from inflation or geopolitics requires proactive monitoring.

  • Set allocation limits for high-risk assets.
  • Build cash reserves for opportunities.
  • Review insurance and estate planning.

5. Regularly Review and Adjust Your Portfolio

Schedule periodic reviews to rebalance and adapt to changes. Continuous education on market trends is essential.

Ongoing Process

Markets evolve, so flexibility is key to long-term resilience.

Key Takeaways:

  • Rebalance annually or after major events.
  • Stay educated through reliable sources.
  • Seek professional guidance as needed.

The Bottom Line

Implementing these steps can help you navigate 2025's investment landscape thoughtfully. Always remember that past performance is not indicative of future results.

Building wealth requires patience and informed decisions—start with education and professional consultation.

This content is brought to you by Vann Equity Management, dedicated to providing insights and guidance to help you achieve your financial goals.

Disclaimer: Investing involves risks, including possible loss of principal. This content is for educational purposes only and does not constitute financial advice nor a solicitation for services. Always consult with a licensed financial professional before making any investment decisions. Vann Equity Management is a registered investment advisor, and all information provided complies with SEC and FINRA regulations. No guarantees of performance are made, and individual results may vary.

Vann Equity Management

Sophisticated Portfolio Solutions for Institutional and Individual Investors